NVDA · GOOGL · IREN · CRWV · CIFR · NBIS
The Jevons Question: Cheaper Intelligence, More Compute—But Who Gets Paid?
Why cheaper AI can expand demand while returns diverge across compute, power and financing.
The answer depends on three separate tests
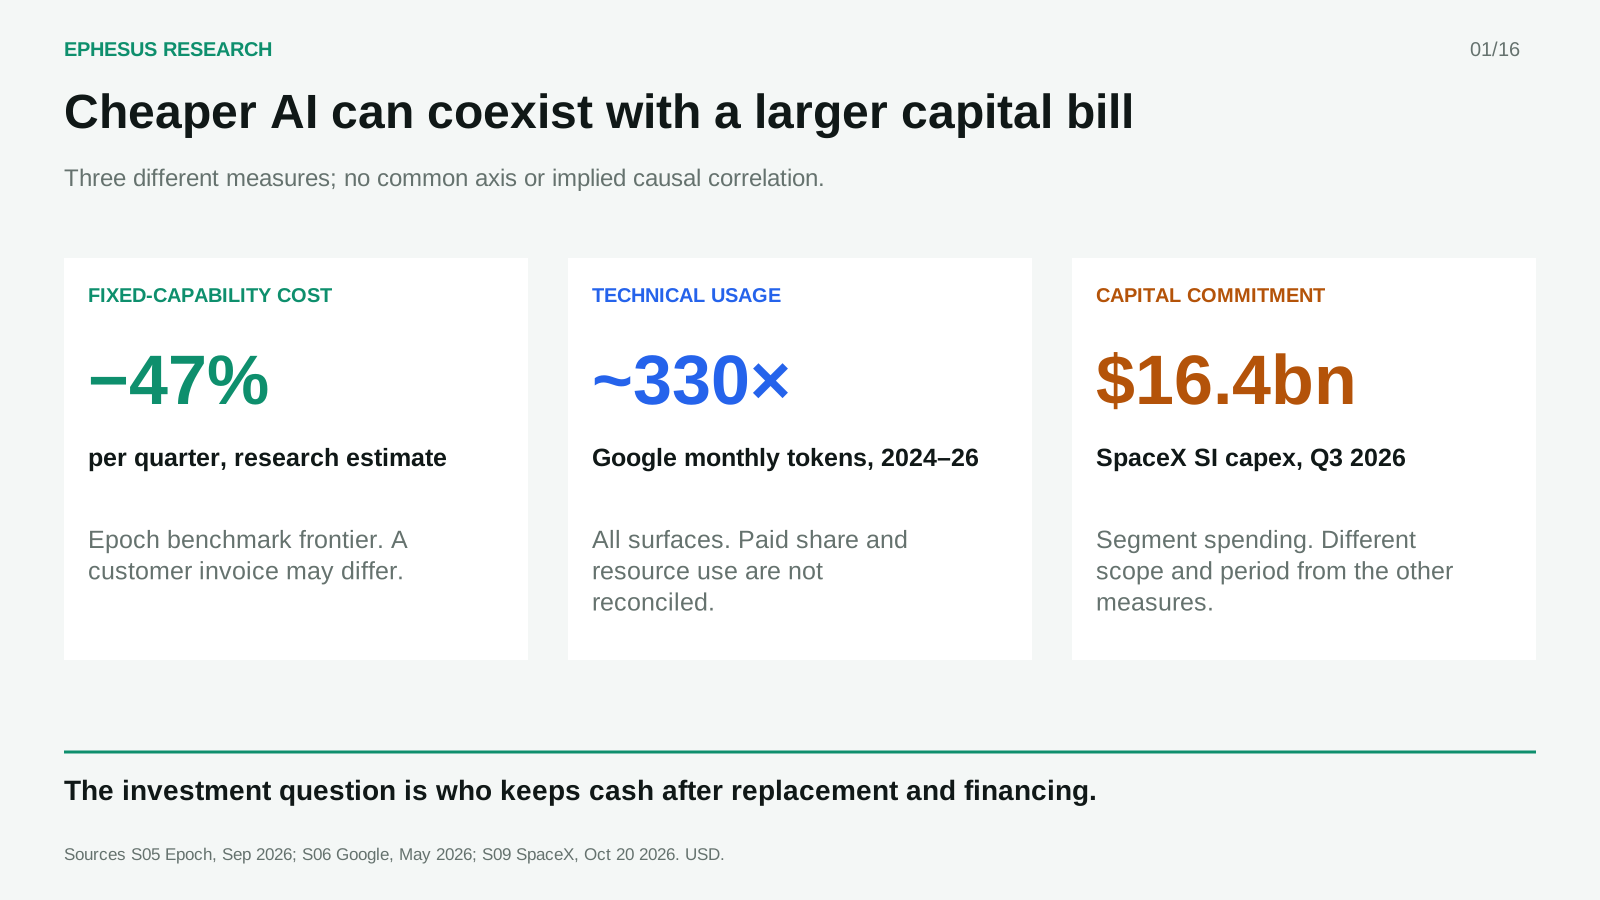
Cheaper intelligence can increase the use of compute and still disappoint its owners. The evidence available on October 20, 2026 supports rapid technical improvement, expanding usage and valuable pockets of scarce capacity. It does not establish that every planned data center will fill, or that every dollar invested will earn an adequate return.
That is the useful way to approach Jevons paradox: efficiency can make a resource more attractive, expanding demand enough to offset the resource saved on each unit of service. But three propositions require three different tests. Does cheaper, equally useful AI attract more paid work? Does that additional work outweigh efficiency improvements and raise total resource consumption? Do suppliers retain enough cash to replace equipment and compensate investors? A yes to the first question is insufficient evidence for the other two.
The strongest bullish evidence is operational. More output can be produced from a power-constrained fleet, while reported usage is growing quickly. The strongest bearish argument concerns ownership: competition may transfer much of that benefit to customers, while equipment replacement and debt payments remain the owner's obligation. Both can be true. This article's preferred case is continued expansion with increasingly uneven returns across projects and business models. That is an analyst inference, not a forecast of a particular share price.
The eight supplied screenshots are treated as claims to investigate. Original posts were not reconstructed from cropped images. Figures below distinguish disclosed observations, company claims, research estimates and hypothetical calculations. The cutoff includes SpaceX's October 20 results; later developments are excluded. Existing Ephesus methodology informs the separation of evidence, assumptions, project gates and dilution. [S37]
Unless stated otherwise, financial amounts are US dollars. Reported financial figures are company disclosures; hypothetical model inputs are expressly labeled and are not market quotes.
What the bull and bear arguments each get right
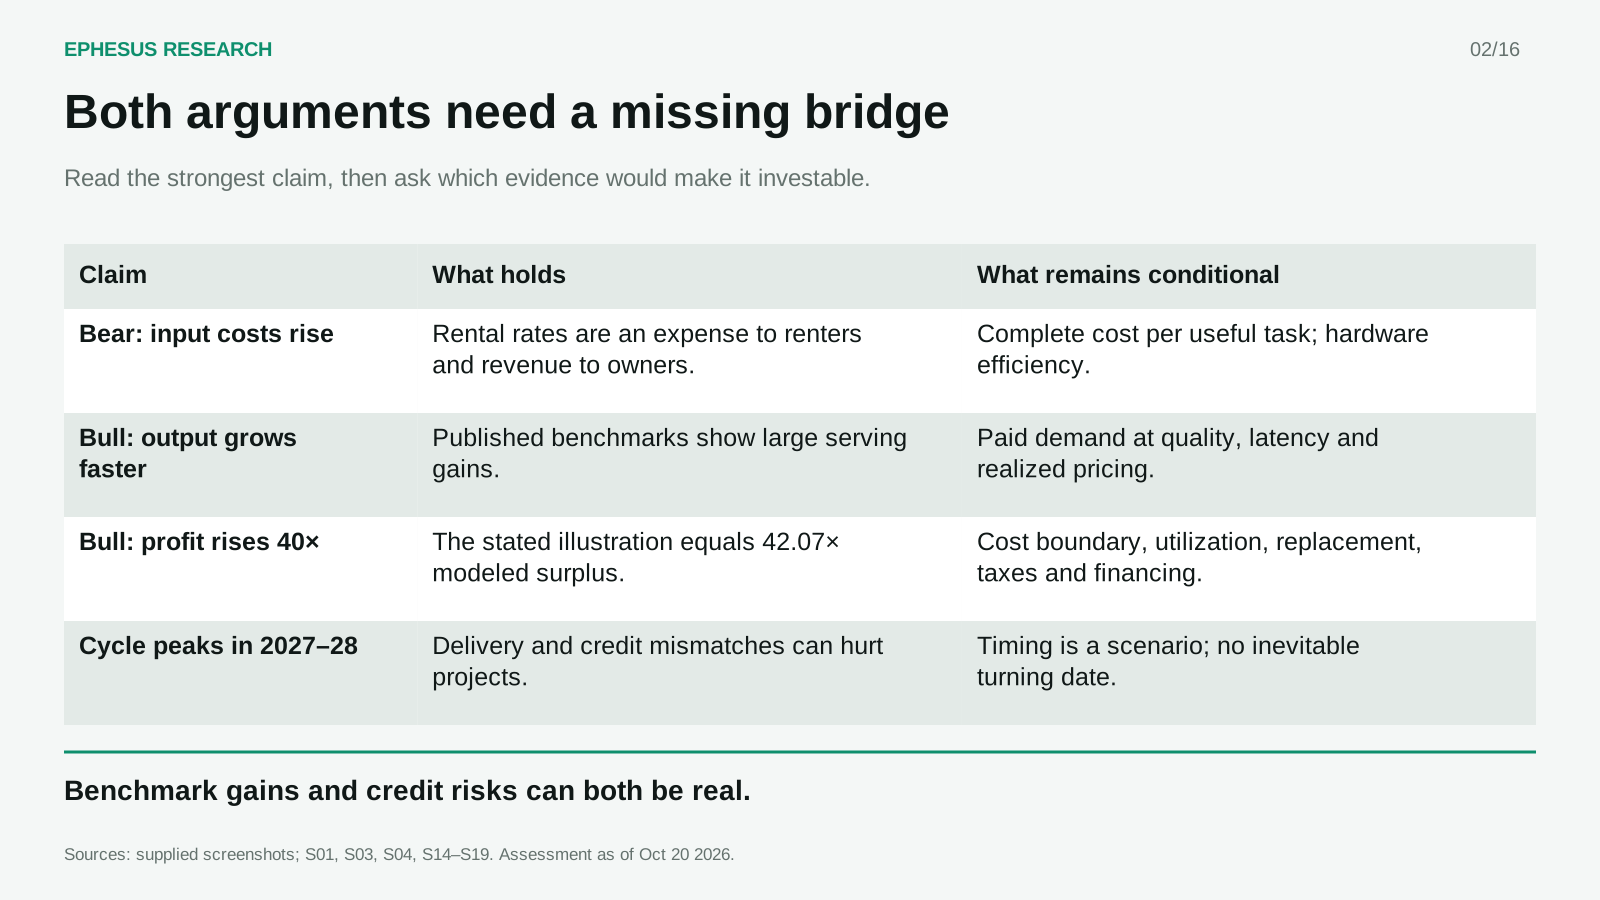
The bearish screenshot combines rising GPU rental prices with falling token prices and calls the combination fatal to a debt-funded capital cycle. The risk is real if a provider's realized selling price falls faster than its complete cost of producing useful work. But a rental hour is an input to a renter and revenue to a hardware owner. It is neither the purchase price of a chip nor the cost of a completed customer task.
The bullish reply correctly changes the denominator: expensive equipment can be economical if it delivers substantially more useful output. Its error is to move too quickly from maximum throughput to sold output and from a serving-cost comparison to profit. Physical capacity does not invoice itself. Demand, utilization, service quality, discounts and collection determine how much technical improvement reaches cash flow.
We therefore retain the bear's financing question and the bull's productivity question. We reject neither because of the other. Rising rental rates can signal scarce usable supply even while the cost of producing a token falls. Falling API prices can stimulate adoption while compressing the profits of less efficient fleets. The same competitive process can reward the buyer, the best operator and a bottleneck supplier differently.
Several stronger statements in the screenshots remain unverified: a universal 50% cancellation/delay rate, uniformly easy Chinese financing, an inevitable 2027–2028 price peak, and government intervention that prevents lenders from withdrawing. Recursive self-improvement is a speculative technological mechanism, not a quantitative credit forecast. Its possible upside cannot be booked as cash available to repay today's debt. The attached claim register preserves these distinctions rather than silently deleting inconvenient claims.
Follow the customer's dollar
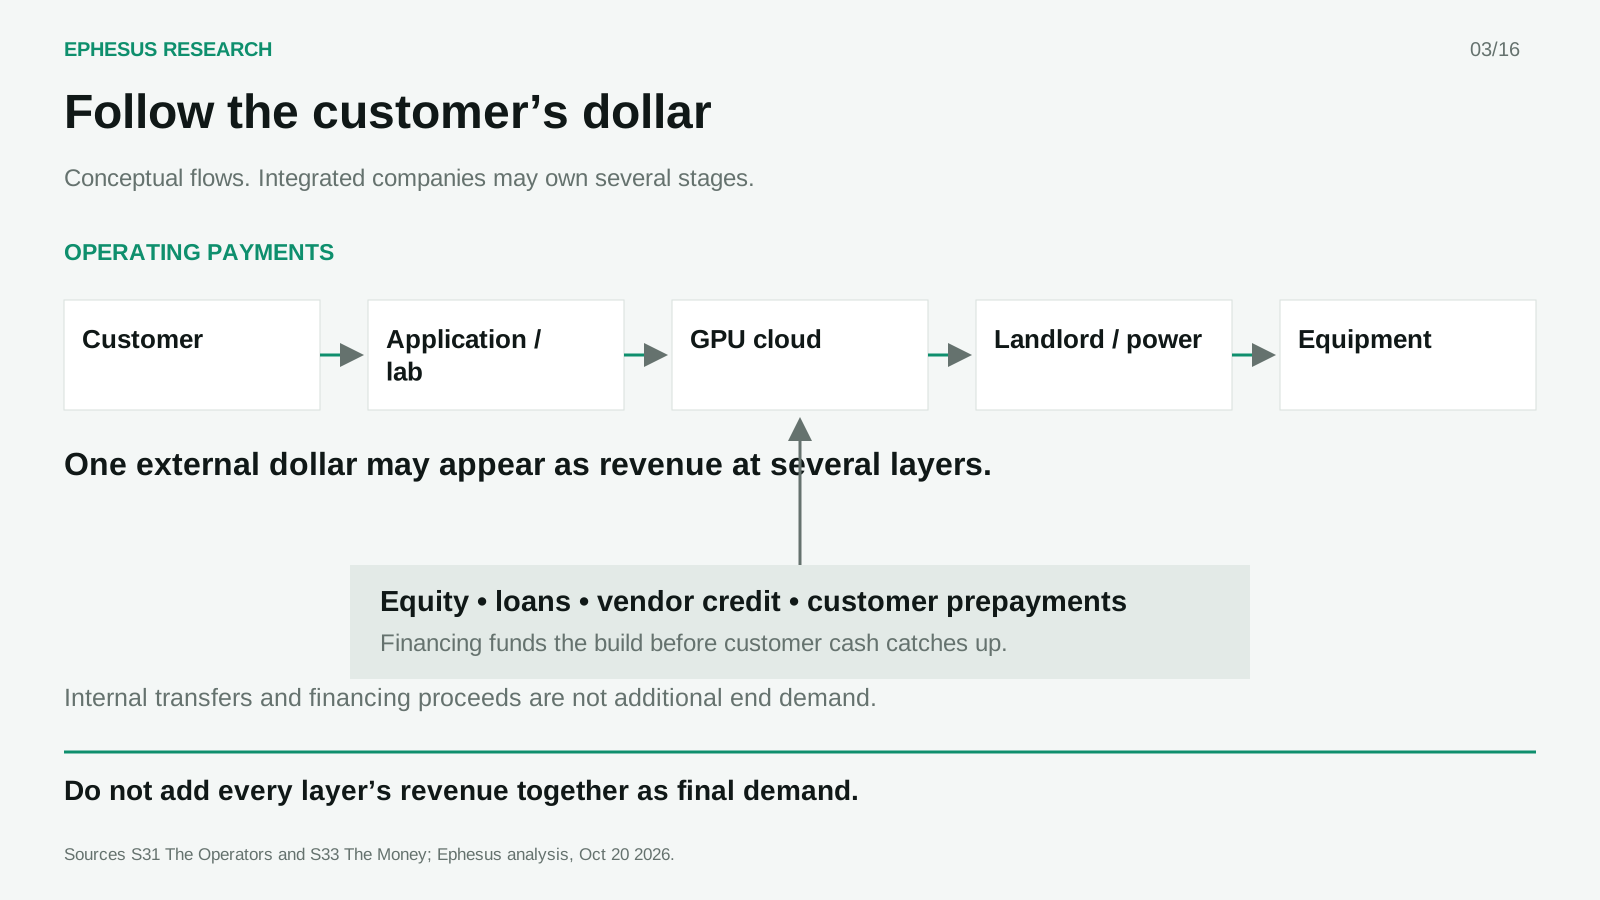
Start with an external customer paying for a useful result. An application may retain part of that payment and buy model services from a lab. The lab may rent GPUs from a cloud operator, which pays a landlord, power supplier, equipment vendor and lenders. An integrated hyperscaler can perform several of those functions internally. Adding every layer's revenue overstates final demand because the same customer dollar appears repeatedly.
Financing enters from a different direction. Equity investors, banks, equipment lenders and strategic suppliers advance money before customers have paid enough to fund the buildout. Customer prepayments accelerate cash receipts but create future service obligations. Vendor credit and capacity backstops can make projects possible. These arrangements are not inherently fraudulent; their durability depends on eventual external demand and enforceable allocation of risk.
The Buildout's The Operators helps separate integrated clouds, specialized GPU providers and mining-site conversions. The Money is useful for tracing funding across counterparties. Its summaries are discovery tools, not independent confirmation of the filings beneath them. Supplier investment in a customer is a reason to inspect terms and concentration, not a substitute for doing so. [S31][S33]
A simple cash map avoids two common mistakes. Internal compute use is not external rental revenue unless a clearly identified accounting allocation is being discussed. And financing proceeds are not operating sales. A lab can have a compelling product and still rely on fresh capital; an equipment supplier can report strong sales while its customers struggle to earn their cost of capital. Returns must be assessed at the entity and cohort where capital was actually committed.
The unit ladder: from successful work to cash
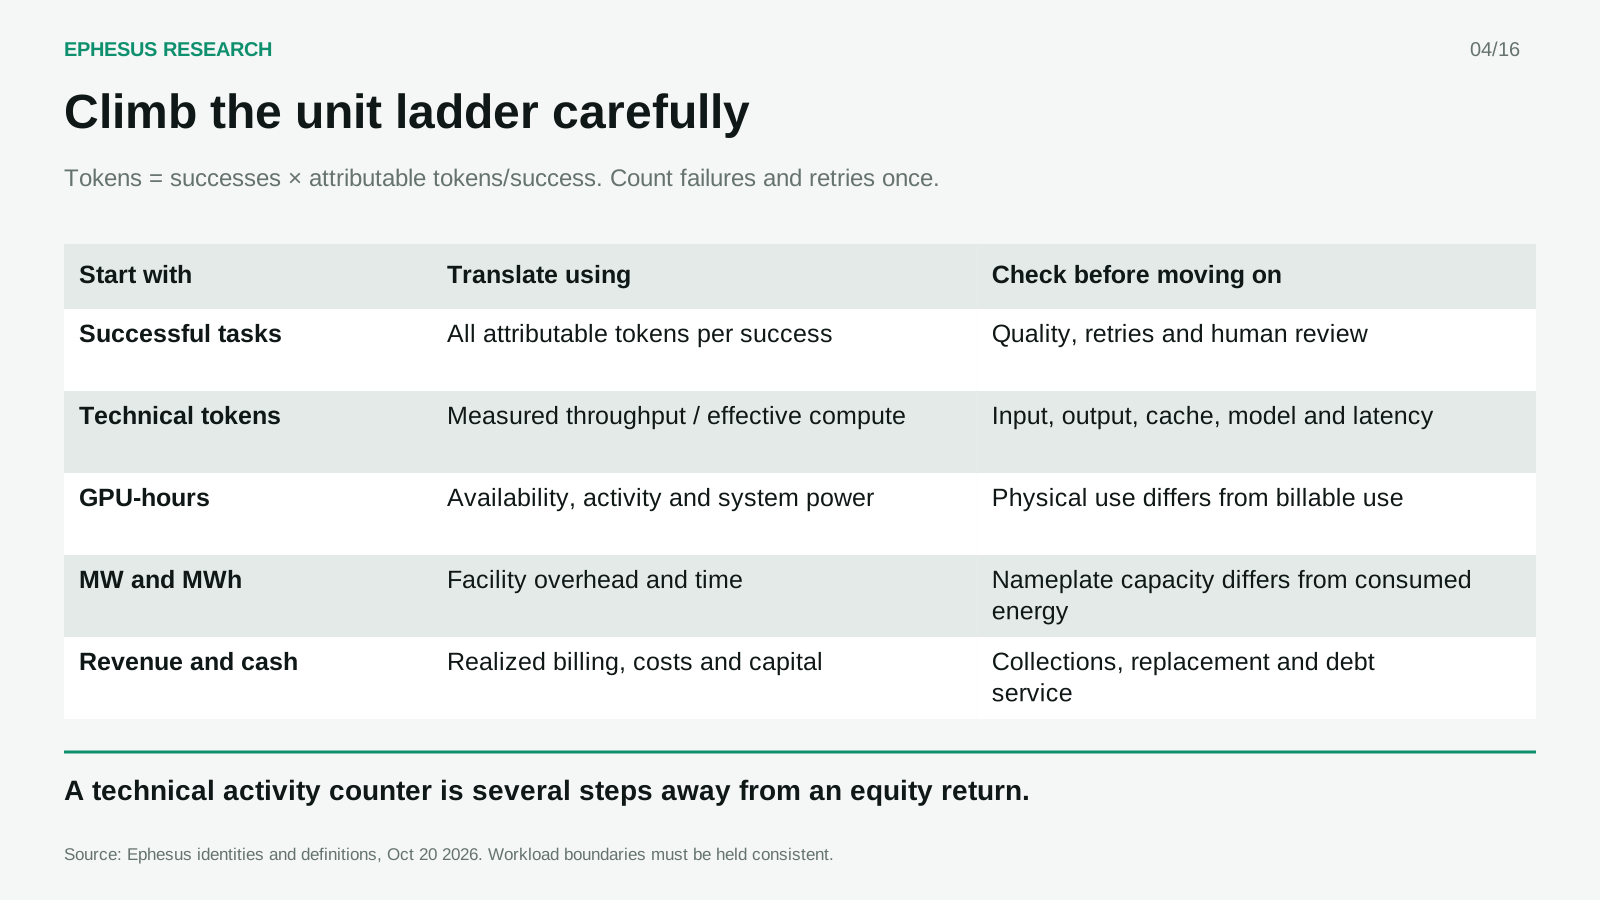
Define the workload before calculating its economics. A successful task means a result meeting a specified accuracy, reliability and response-time requirement. Tokens are pieces of model input or output; their size and computational burden differ by model and modality. The accounting identities are straightforward:
Compute = tokens × effective compute per token
Variable energy = compute × system energy per compute unit
Tokens per success includes the allocated work of failures and retries. Count that effort once. Compute per token incorporates architecture, context, caching and the workload mix. Add training, idle draw, shared systems and facility overhead only when they are outside those boundaries. A long video-generation job cannot be represented by an average short text query.
To convert work into GPU-hours, measure throughput at the required service quality and latency. Prefill processes the prompt; decode produces the response. Memory capacity and bandwidth, cache, interconnect and batching can constrain either stage. A chip's peak arithmetic operations do not determine how many satisfactory responses a live service can sell.
Revenue is the sum of each billed token category multiplied by its realized price, plus separately identified subscriptions or reserved-capacity charges. Do not add a subscription's included token consumption again as hypothetical API revenue. Technical tokens and billed tokens are different populations. Similarly, 1 MW is a rate of power, while 1 MWh is energy over time. Reserved electrical capacity, energized facility load and accepted IT equipment describe different stages, not interchangeable measures of commercial production.
Cheaper capability and expensive frontier products coexist
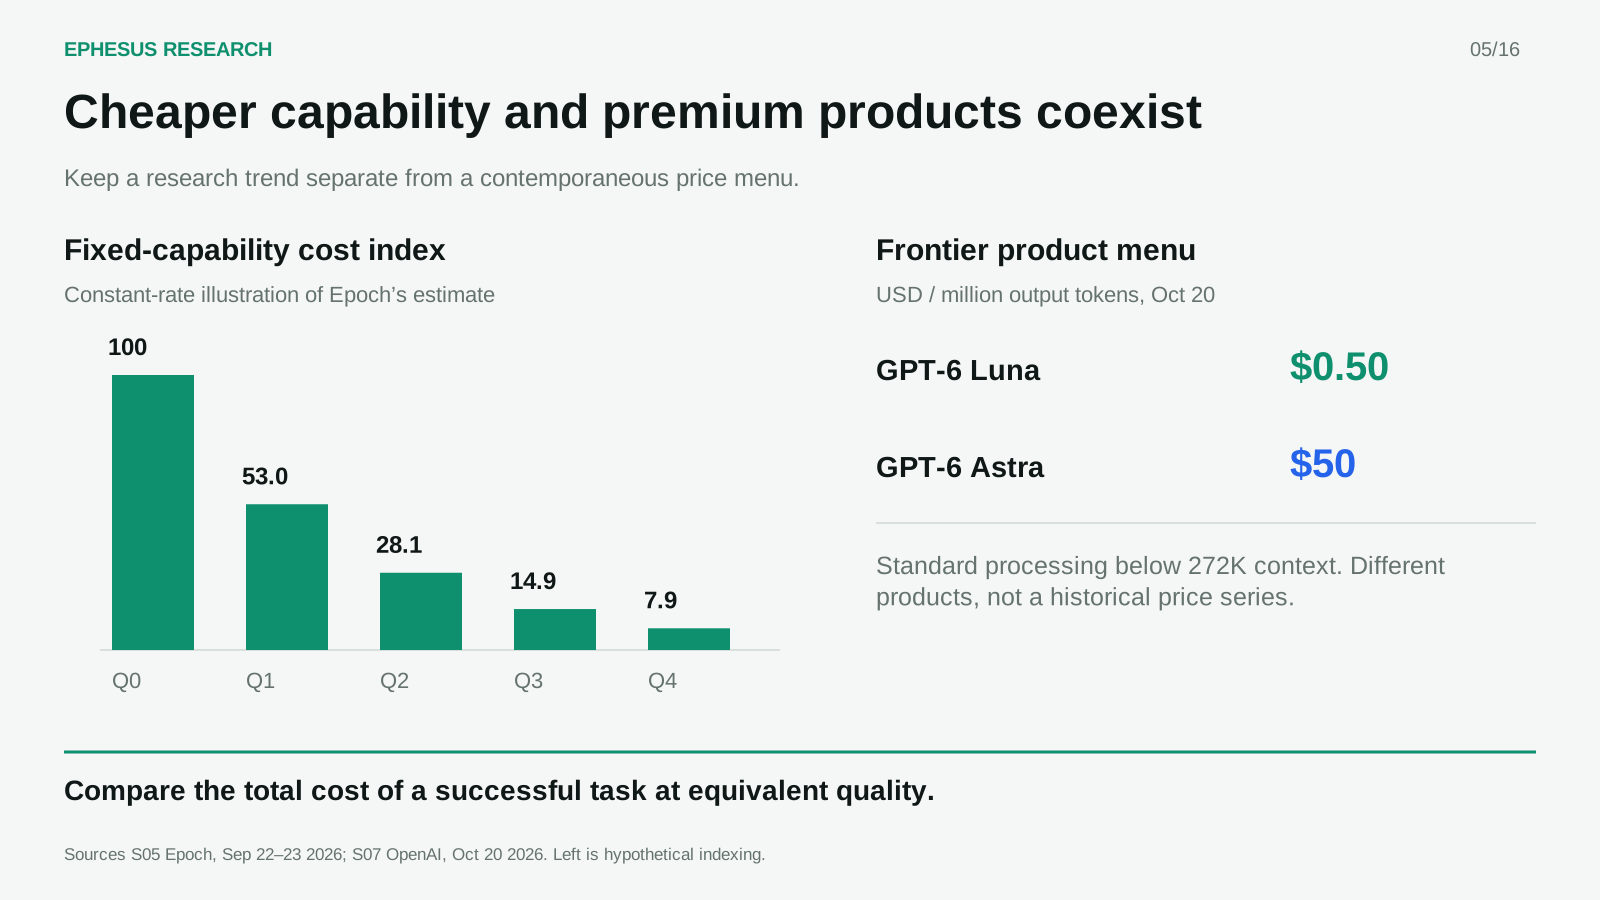
Epoch AI estimates that the cost of achieving a given measured capability fell about 47% per quarter across its benchmark framework. Its September 2026 study examines the cost frontier, not the invoice of a representative customer. The visual's index of 100, 53, 28.09, 14.89 and 7.89 is a constant-rate illustration of that estimate, not five observed quarterly prices. Benchmark targeting, switching costs and imperfect correspondence to useful work limit the inference. [S05]
Meanwhile, OpenAI's October 20 pricing page lists GPT-6 Luna at $0.50 and GPT-6 Astra at $50 per million output tokens, for standard processing below 272,000 context tokens. This is a contemporary product menu. It establishes differentiation, not historical inflation in the price of the same capability. The quoted output prices omit input charges, cache mix, discounts and the number of tokens needed to finish a task. [S07]
Customer economics provides the missing discipline. Consider a hypothetical task requiring 30 minutes of labor at $60 an hour: a $30 resource allocation. Suppose AI assistance costs $0.50 including retries, allocated integration costs $2, three minutes of review costs $3, and a 10% probability of 20 minutes of rework adds $2 in expected cost. The assisted result costs $7.50, leaving $22.50 of potential benefit if quality is equivalent.
That benefit becomes cash savings only if spending falls, or additional output earns collected revenue. A field study of support agents found a 15% average productivity gain, with uneven benefits. METR's 2026 update cautions that newer coding results are affected by selection and measurement problems. Neither establishes universal customer savings. Willingness to pay must be tested within the actual workflow. [S29][S30]
Rental rates: scarcity evidence with a revision problem
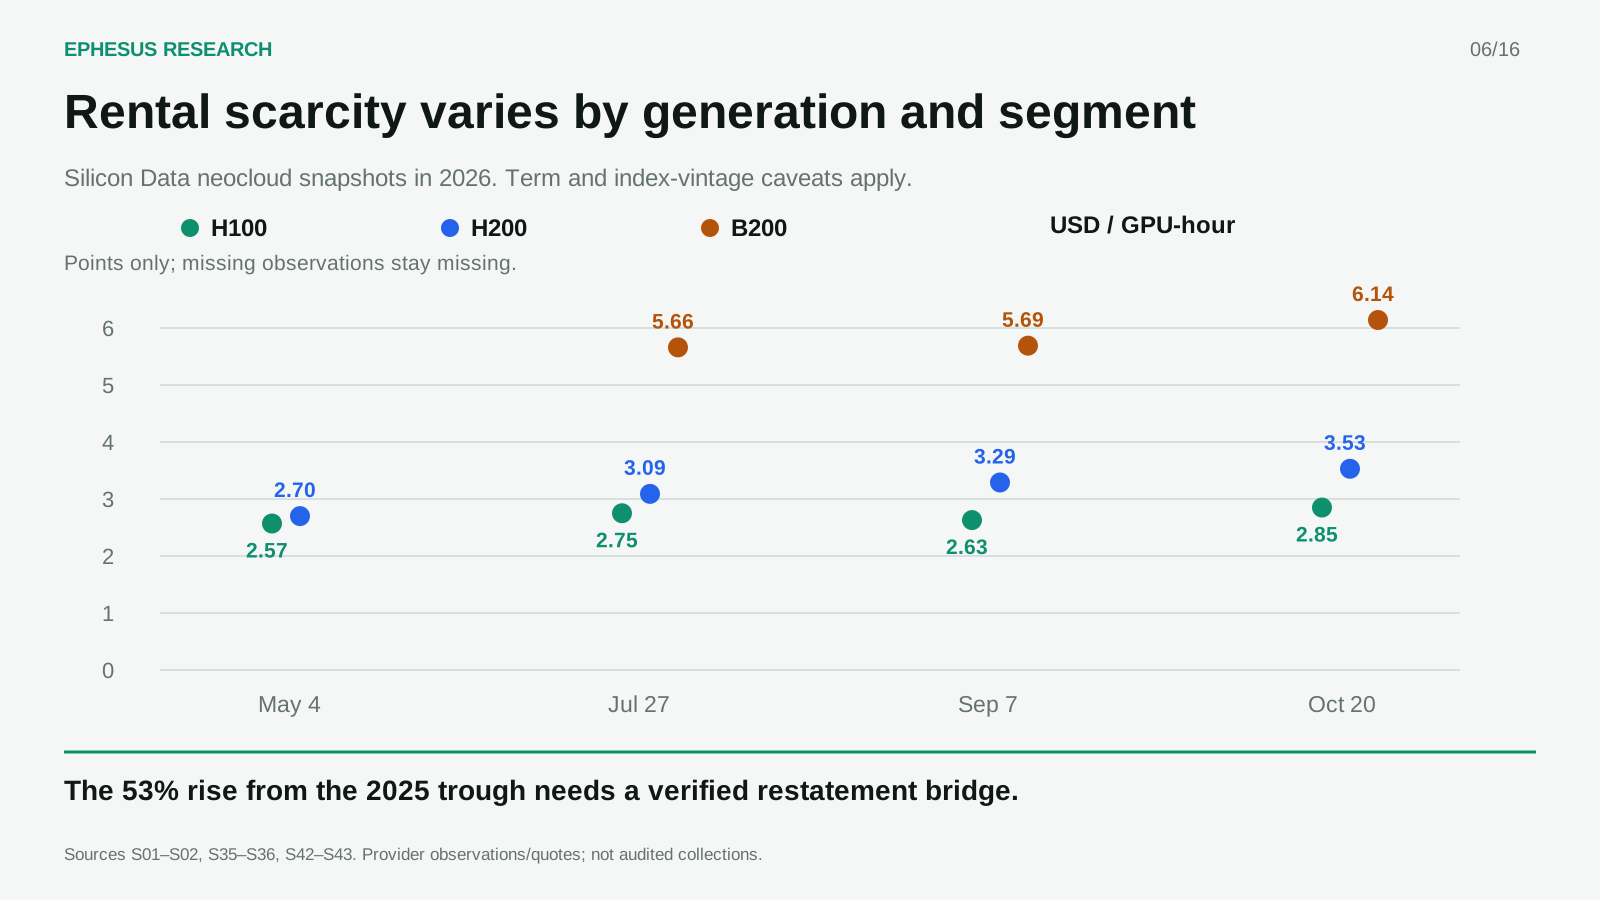
Silicon Data's dated October 20 H100 neocloud reading is $2.85 per GPU-hour. The same page's undated FAQ says $2.53. We use the dated reading and retain the inconsistency. The provider normalizes observations for characteristics such as contract term, scale and geography; the index is not the advertised price of one interchangeable GPU. [S01]
The screenshot's 53% rise from February 2025 needs a consistent historical vintage. Silicon Data announced a major H100/A100 methodology revision in December 2025, including wider coverage and normalization changes. Without the restatement bridge, the exact trough-to-current percentage remains provisional. The picture is useful evidence of what was claimed, not a substitute for the underlying series. [S02]
The chart therefore plots only dated points from the same provider. H100 readings move from $2.57 on May 4 to $2.75 on July 27, $2.63 on September 7 and $2.85 on October 20. Separate H200 and B200 observations illustrate differences between generations. Missing observations remain missing. The B200 report describes standardized provider quotations; neither its prices nor the broader index family should be described as audited cash collections. [S35][S36][S42][S43]
Contract duration also matters. September 7 B200 figures include $5.69 spot and $5.39 for twelve months. A buyer accepting duration is purchasing a different exposure. Regional hyperscaler H100 price declines reported by Silicon Data coexist with recovering neocloud rates, undermining the claim that every segment is tightening uniformly. [S36][S38] For an owner, the decisive observation is the next comparable renewal, after discounts, service credits and delivery conditions—not the highest displayed quote.
The hardware gain is real; the profit multiplier is conditional
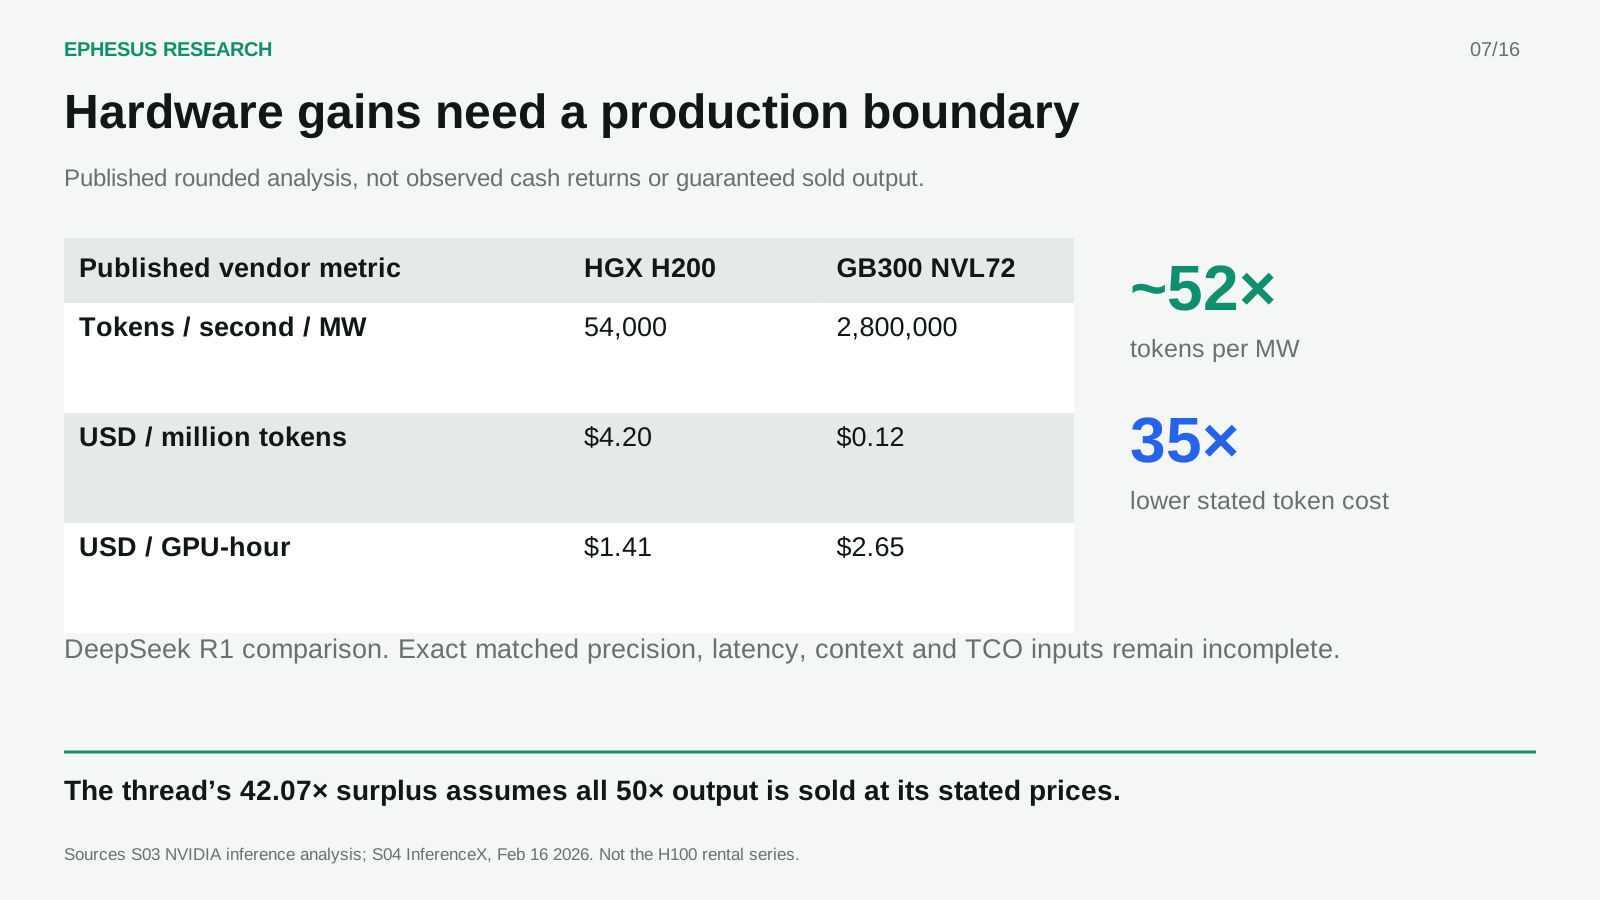
NVIDIA's published comparison is HGX H200 against GB300 NVL72, not the H100 rental series. It reports 54,000 versus 2.8 million tokens per second per MW and $4.20 versus $0.12 per million tokens in a DeepSeek R1 analysis. These are vendor estimates. The table does not fully expose matching precision, context, latency, utilization and all cost assumptions alongside those numbers. [S03]
Rounded inputs also resist exact reconciliation: $1.41 per GPU-hour divided by 90 tokens per second produces about $4.35 per million, rather than $4.20. That is a reason to preserve the published comparison and disclose its limits, not manufacture a more precise TCO. InferenceX independently demonstrates that relative economics vary sharply with response speed and precision. Its illustrative economics exclude underutilization and downtime. [S03][S04]
The thread's arithmetic is correct under its assumptions: 50 × ($5 − $0.12) ÷ ($10 − $4.20) = 42.07. Fifty times the sold volume at half the price produces 25 times revenue. Total modeled serving cost rises 1.43 times because output grows faster than unit cost falls. The remaining quantity is illustrative modeled surplus on the stated cost basis, not demonstrated net profit or return on invested capital.
The commercial assumptions do the work: all output is sold, quality remains comparable, prices are realized, and the cost boundary is adequate. If machines sit idle, fixed costs are spread over fewer sold tokens. A low unit cost calculated at high throughput cannot simply be held constant while assuming low utilization. Older fleets may remain profitable to run above avoidable cost while failing to earn enough to justify replacement. Physical survival and economic competitiveness are different tests.
Jevons: distinguish rebound from backfire
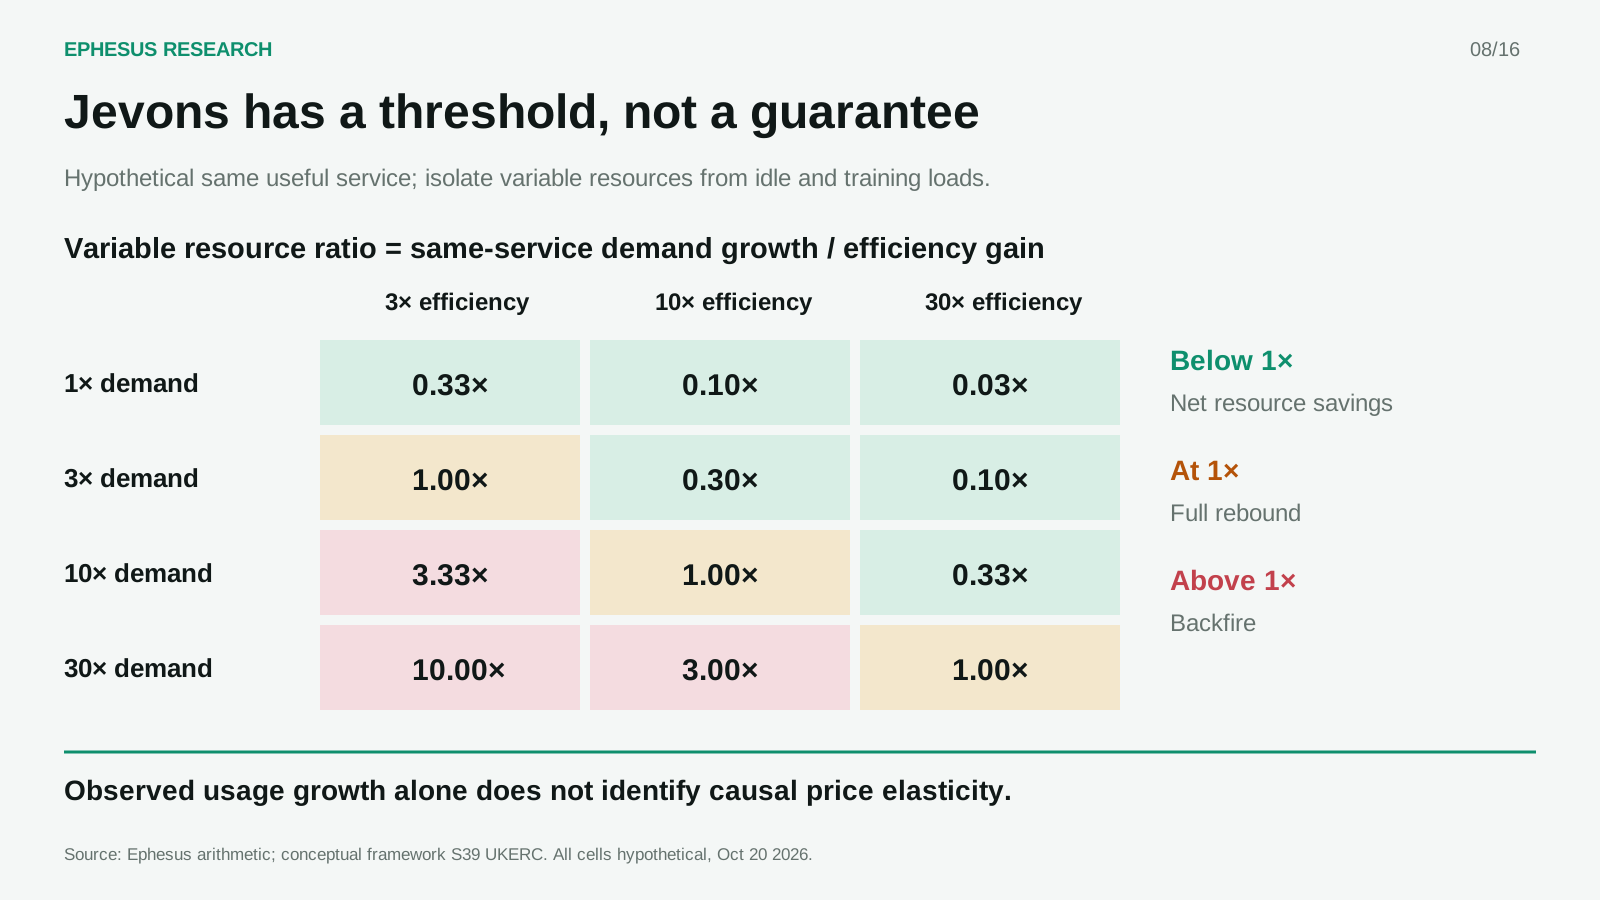
Direct rebound means customers use more of a service because efficiency makes it cheaper. Wider rebound includes spending the savings elsewhere and changes in production and prices across the economy. Backfire occurs when the resource increase outweighs the initial saving. Historical research explains these mechanisms, but does not supply an empirical AI demand elasticity. [S39]
Hold the useful service constant. If efficiency improves tenfold and demand grows threefold, variable resource use becomes 0.3 times its starting level. At tenfold demand it returns to one times; at thirtyfold demand it reaches three times. The middle case is full rebound. Only the last is backfire in this simplified resource comparison. For causal attribution, demand must be compared with what would have happened without the efficiency improvement, rather than assuming all observed growth was caused by cheaper prices.
Price pass-through adds another dimension. If prices halve, those demand outcomes imply 1.5, five and fifteen times revenue. If prices fall 90%, they imply 0.3, one and three times revenue. These are scenarios, not measured elasticities. The physical threshold and the revenue threshold differ, and neither threshold alone determines profit.
Budgets, integration effort, reliability and human review constrain demand. Available power, delivery dates and financing constrain supply. Better models and wider distribution can independently increase usage, confounding a simple price-versus-volume regression. The relevant investment question is therefore how much paid, successful work can reach a specific fleet before its equipment or contracts need renewing. Lower unit costs can support higher aggregate spending. They can also intensify competition and transfer a large share of the benefit to customers.
Token growth measures activity, not customer value
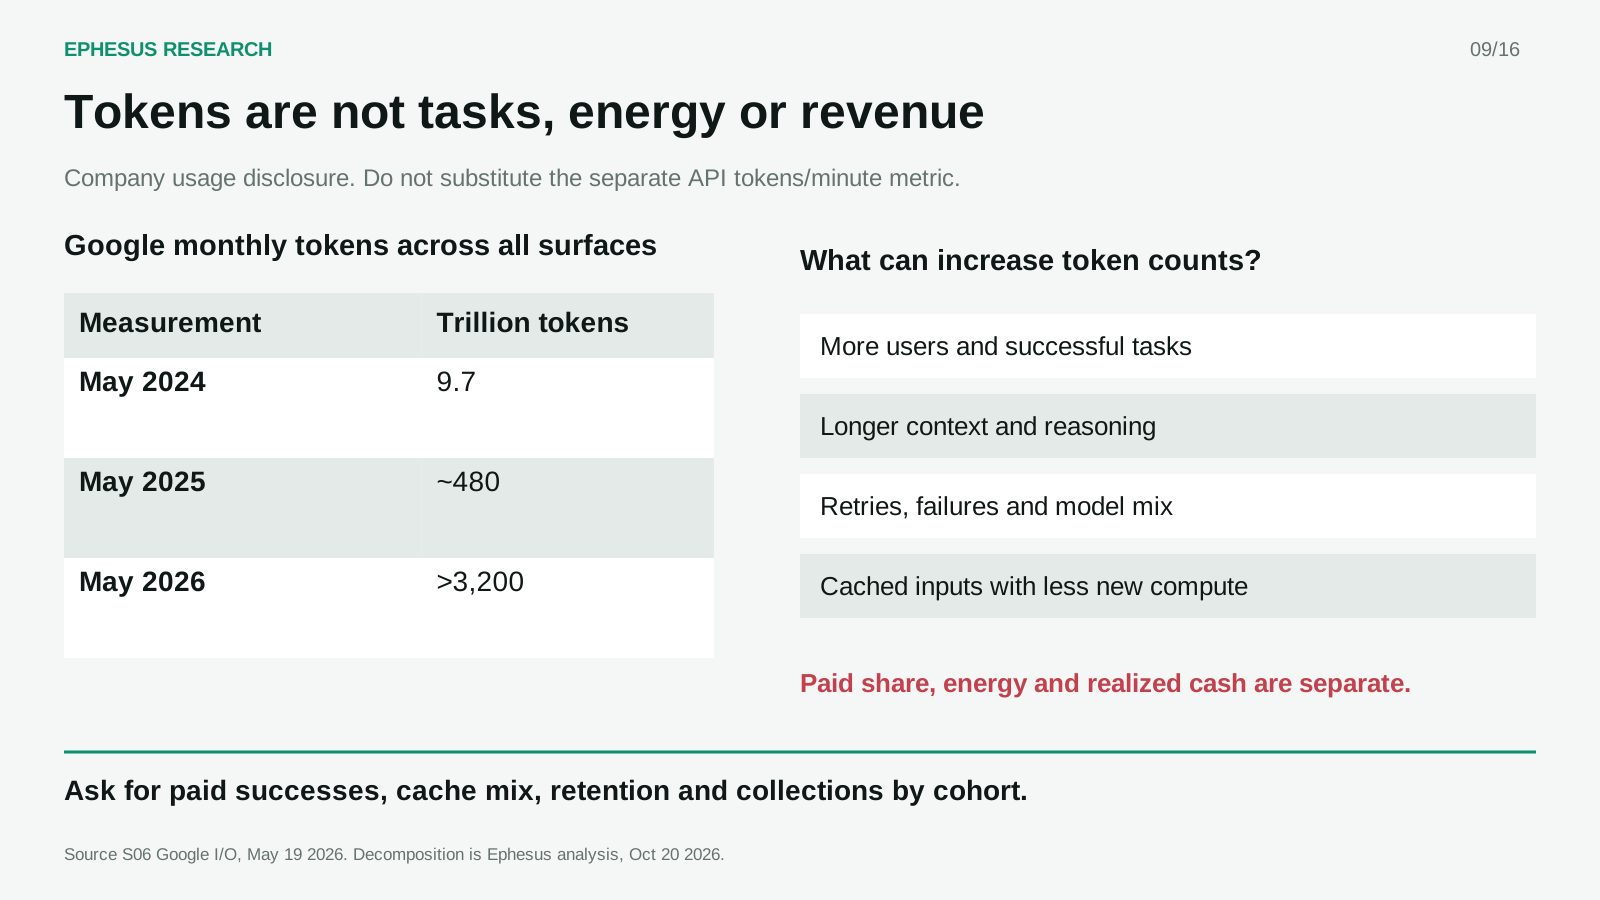
Google reported 9.7 trillion monthly tokens across its surfaces in May 2024, about 480 trillion at I/O 2025 and more than 3.2 quadrillion at I/O 2026. That is more than 330 times the first figure. The scope is all Google surfaces. Its separately disclosed API rate is not the denominator of this time series. These are company usage claims, not a reconciliation to paid transactions, electricity or revenue. [S06]
Growth can come from more users, more tasks per user, longer context, additional reasoning, retries or entirely new media. Caching can increase the number of technical tokens handled while reducing repeated computation. A token of cached input does not have the same resource or billing implications as a newly generated output token. Better task success may reduce waste even as total usage expands.
Separate adoption from intensity. A useful operating dashboard records paid successful tasks, total attempts, tokens by category, cache-hit rates, latency and collected revenue for a stable customer cohort. It then asks whether the customer renews and whether serving that cohort remains economical after replacement. An aggregate token counter cannot answer those questions.
The distinction cuts both ways. Token growth should not automatically validate a capital plan, but absence of proportional API revenue does not mean the usage has no value: it may support subscriptions, advertising, retention or internal productivity. Those benefits need a separate bridge to cash. An investor should demand that bridge rather than assigning either zero value or the full list-price value to every technical token. The change in useful output and the business model that captures it are the important variables.
DeepSeek's $38 is a revenue claim, not a margin
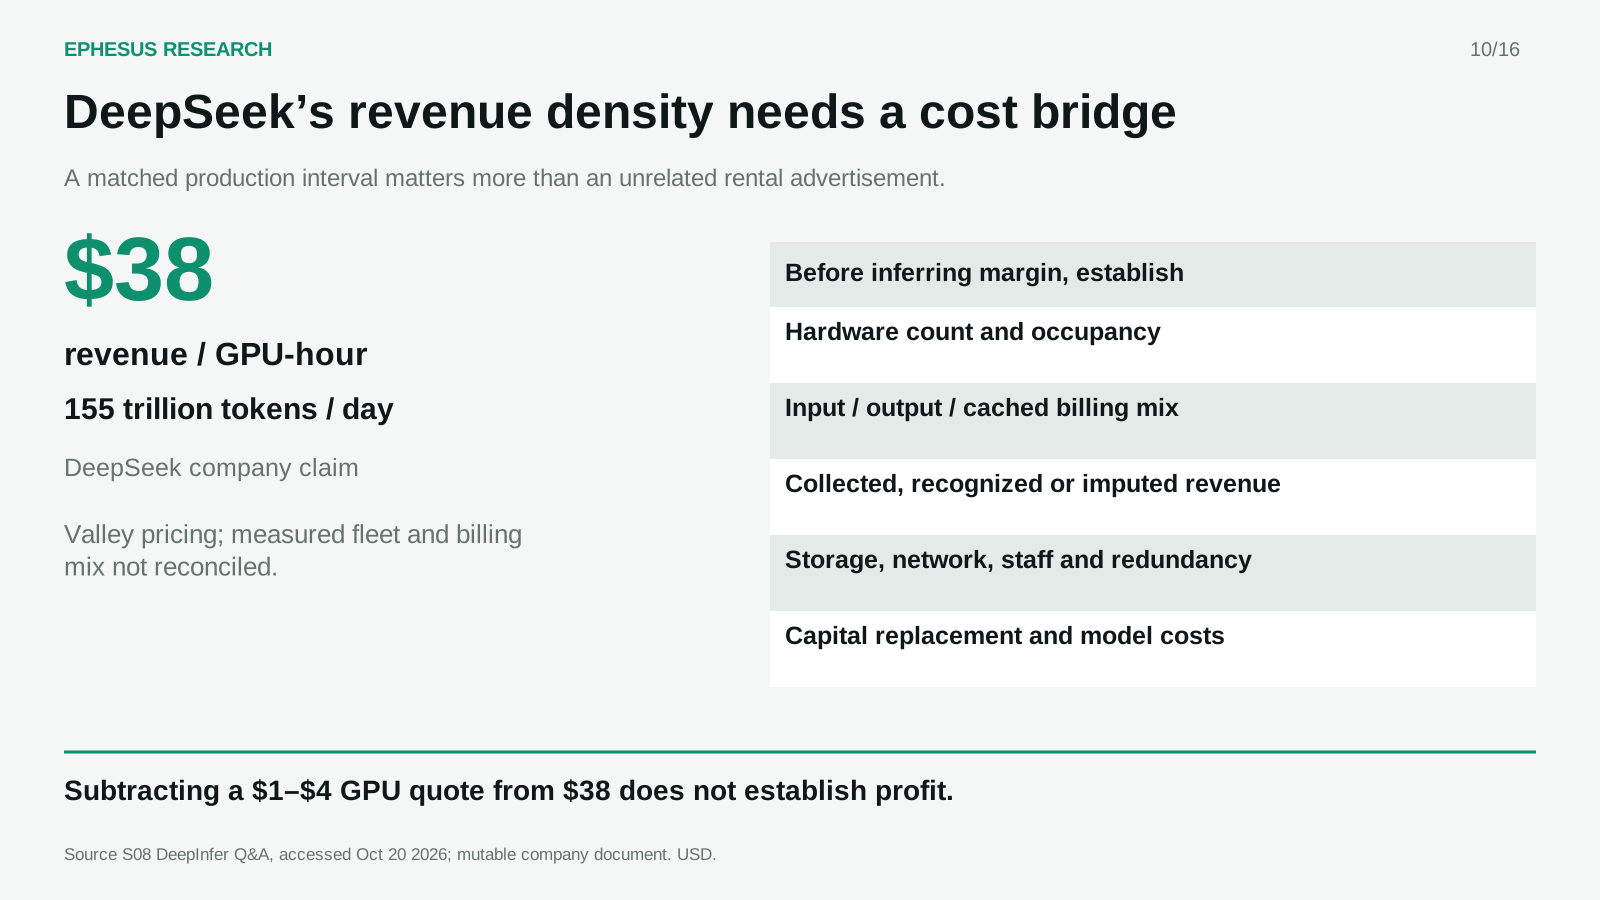
DeepSeek's DeepInfer Q&A says a V4.1 Flash cluster serves 155 trillion tokens daily with $38 of revenue per GPU-hour at valley pricing. The framework supports NVIDIA and Huawei Ascend, but that does not disclose the measured cluster's hardware mix or size. The document also describes substantial cache infrastructure, including roughly 14.4 TB of logical storage per online GPU. It is a mutable company document accessed October 20. [S08]
The important missing reconciliation covers input, output and cached tokens; GPU count and occupancy; the measurement period; realized discounts; and whether the revenue figure represents collections, accounting revenue or an imputed rate-card value. “Valley pricing” should not be casually translated into cheap electricity. Nor does the minimum example deployment establish the denominator behind the headline.
Subtracting a $1–$4 GPU rental advertisement from $38 crosses incompatible boundaries. The rental may describe another accelerator, network configuration, region, duration or service. The operator may also pay for host servers, storage, networking, software, staff, redundancy and model development. If revenue is attributed to only one stage of a disaggregated serving system, the other stages still require capital and operating costs.
The claim is nevertheless informative. It identifies a potentially valuable combination of model design and serving infrastructure, and creates a testable question about revenue density. Verification would require a matched production interval with fleet counts, billing records, service levels and a complete cost bridge. Until then, it is evidence that DeepSeek made a striking operational claim. It does not demonstrate an unlimited arbitrage available to GPU clouds, or that revenue per GPU-hour will survive competition and renewal.
SpaceX: present scarcity versus lifetime payback
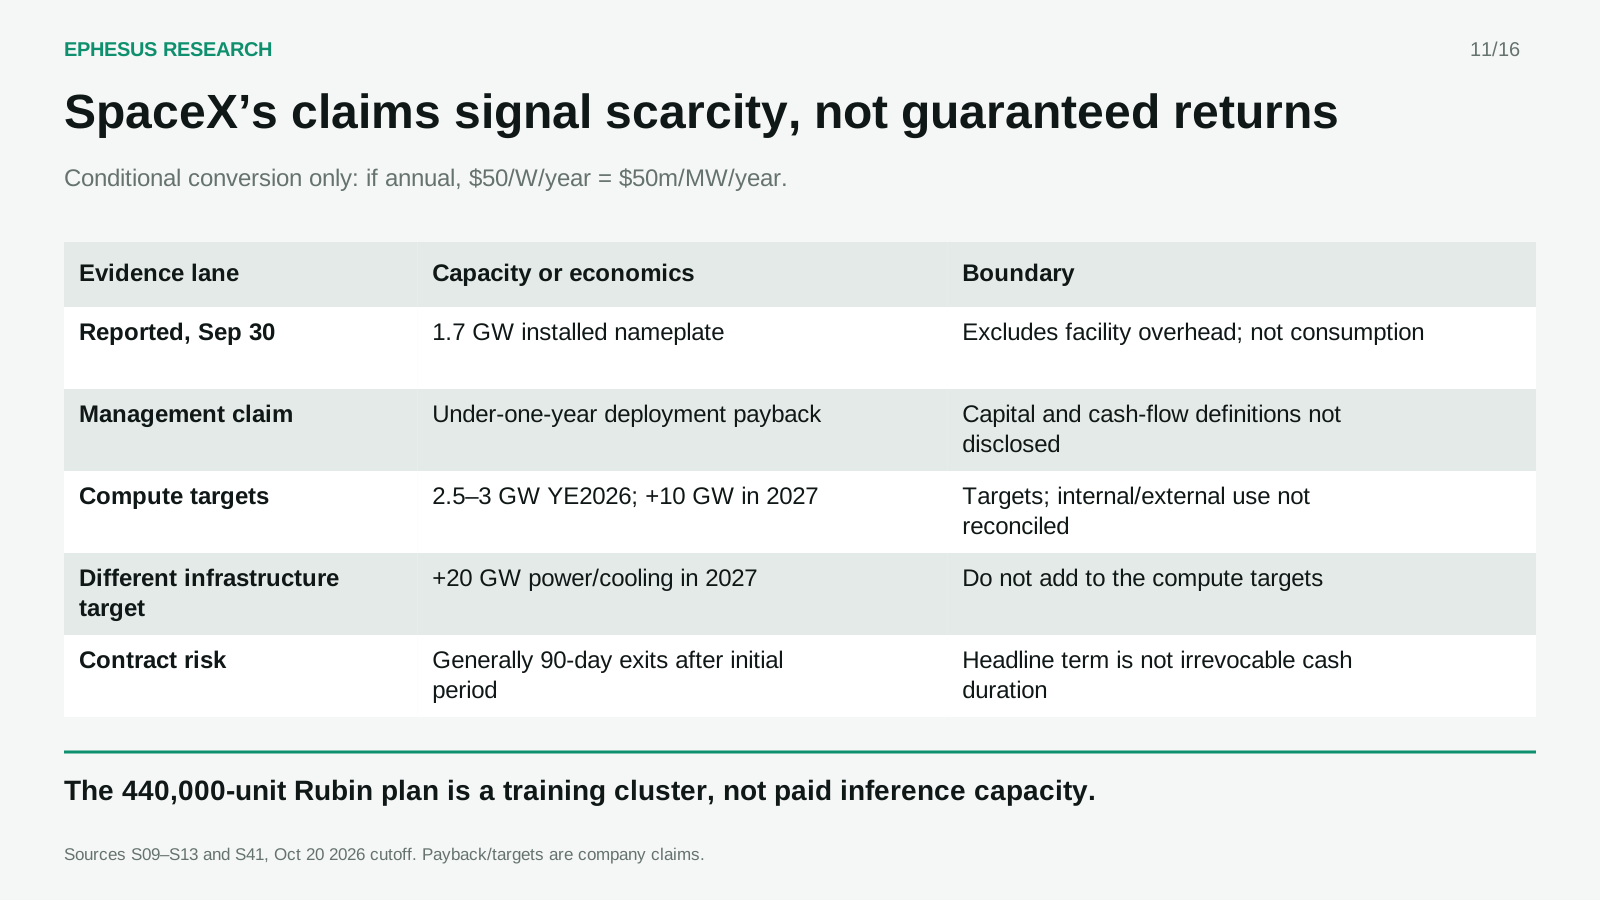
SpaceX's October 20 release reports third-quarter Superintelligence revenue of $7.560 billion, operating income of $431 million, adjusted EBITDA of $4.953 billion and capital expenditure of $16.444 billion. The segment includes more than external compute rental: advertising, software and other services complicate a single revenue-per-watt calculation. Installed nameplate compute was 1.7 GW at September 30. These are reported interim figures, not an independent validation of cohort economics. [S09]
The June filing establishes that xAI became wholly owned in February 2026. It defines nameplate compute using installed GPUs and their power draw, excluding facility overhead. That is capacity, not measured electricity use. Cloud fees generally reserve capacity monthly, and agreements become terminable by either party on 90 days' notice after an initial period including ramp. [S10]
According to the earnings-call transcription, CFO Bret Johnsen said new deployments were achieving payback under one year at current pricing, somewhat above the earlier $30–$50/W range. The capital denominator, cash-flow definition, taxes, financing, ramp origin and renewal assumptions are not disclosed in the located explanation. We do not assume they were excluded. The official event and webcast link were retrieved; the audiovisual remarks were not independently reviewed. [S11][S41]
The period attached to dollars per watt also remains unresolved. Conditional arithmetic is safe: if annual, $50/W/year equals $50 million/MW/year. This is compute-service revenue, not an electricity tariff. It cannot be multiplied indiscriminately by every announced gigawatt, particularly capacity allocated internally to training.
The transcript distinguishes a 2.5–3 GW year-end 2026 target, an additional 10 GW of compute in 2027, a 440,000-unit Rubin training cluster by end-Q2 2027 and an additional 20 GW of power/cooling infrastructure. The plans overlap. Prepared remarks cite roughly 200,000 GPUs monthly, while later remarks cite 220,000. They are deployment aspirations, not paid inference capacity. [S11]
Credit terms provide the strongest counterweight. A June offering disclosure describes a multi-year Anthropic arrangement with a 90-day exit after an initial three months. Headline duration therefore exceeds irrevocable cash duration. [S12] Separately, SpaceX's response to SEC staff removed its lowest-cost-per-token claim and acknowledged limited comparability with competitors. [S13] Rapid current payback could be valuable, but neither scarce capacity nor management's estimate establishes lifetime or industry-wide returns.
A complete cost bridge changes the investment question
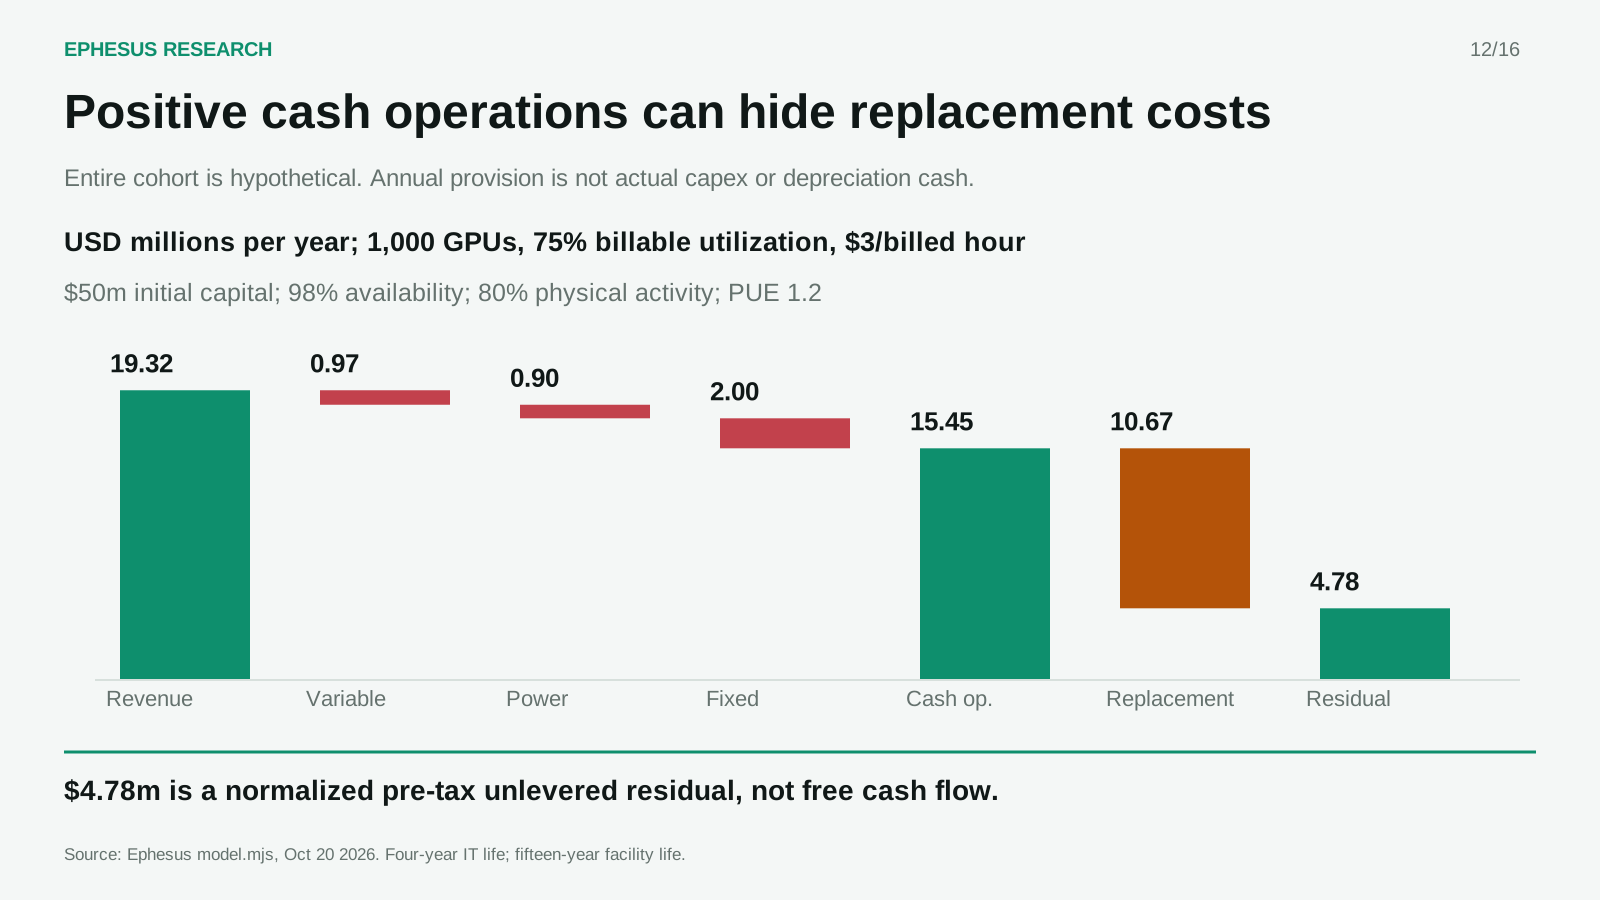
Consider a wholly hypothetical 1,000-GPU cohort, designed to expose the arithmetic rather than represent a specific company. Initial capital is $50 million: $30 million of accelerators, $10 million of other IT and $10 million of allocated facility investment. Availability is 98%; billable utilization is 75% of available hours. At $3 per billed GPU-hour, annual revenue is $19.316 million.
Physical load is assumed to average 80%, independently of billable utilization. An IT system drawing 0.3 MW idle and 1 MW fully active averages 0.86 MW. With power usage effectiveness, or PUE, of 1.2, facility demand averages 1.032 MW: 9,040.32 MWh over 8,760 hours. At $100/MWh that costs $0.904 million. Additional variable expense of $0.15 per billed GPU-hour costs $0.966 million; fixed cash expense adds $2 million.
Cash operating surplus before tax, financing and capital spending is $15.446 million. Annualizing replacement of $40 million IT over four years and $10 million facility over fifteen gives a $10.667 million provision. The resulting $4.779 million is a normalized pre-tax unlevered residual, not actual free cash flow, accounting profit or an IRR. Actual cash flows require timed replacements, working capital, taxes and terminal proceeds. Depreciation must not be subtracted again as cash replacement spending.
At those held assumptions, break-even rent is $2.258 per billable GPU-hour. At $3 rent, billable utilization must exceed 55.5%; at $2 it must exceed 85.5%. Shortening assumed IT life from four to three years raises the break-even rent to $2.775. A $1 rental decline removes $6.439 million annually, compared with $0.452 million from a $50/MWh tariff increase. The model includes a separate capital-recovery sensitivity to the required return.
Real diligence expands each bucket: CPUs, high-bandwidth memory, network, storage, racks, electrical equipment, cooling, land/building, installation, commissioning, demand charges, staff, software, maintenance, spares and overhead. Model training/R&D belongs in the relevant business boundary. Lease payments, vendor financing and owned assets must receive consistent treatment. Newly purchased equipment must recover committed capital; an already-owned fleet may rationally operate above avoidable cost while its economic value declines.
Power access is valuable even when the bill is modest
Electricity's operating-cost share and the strategic value of obtaining energized capacity answer different questions. In the hypothetical cohort, electricity is relatively small beside capital recovery. Yet without deliverable power, almost no rental revenue can begin. A scarce complement can determine the entire project's start date without being its largest accounting expense.
The Buildout's The Queue usefully describes synchronization: servers, cooling, transformers, fiber, labor and permits must arrive together. Its IREN profile and earnings recap identify commissioning and the conversion of contracted ARR into recognized revenue as key questions; the primary results release makes testing and customer acceptance explicit dependencies. These sources helped select diligence questions, not settle them. [S32][S34][S40][S14]
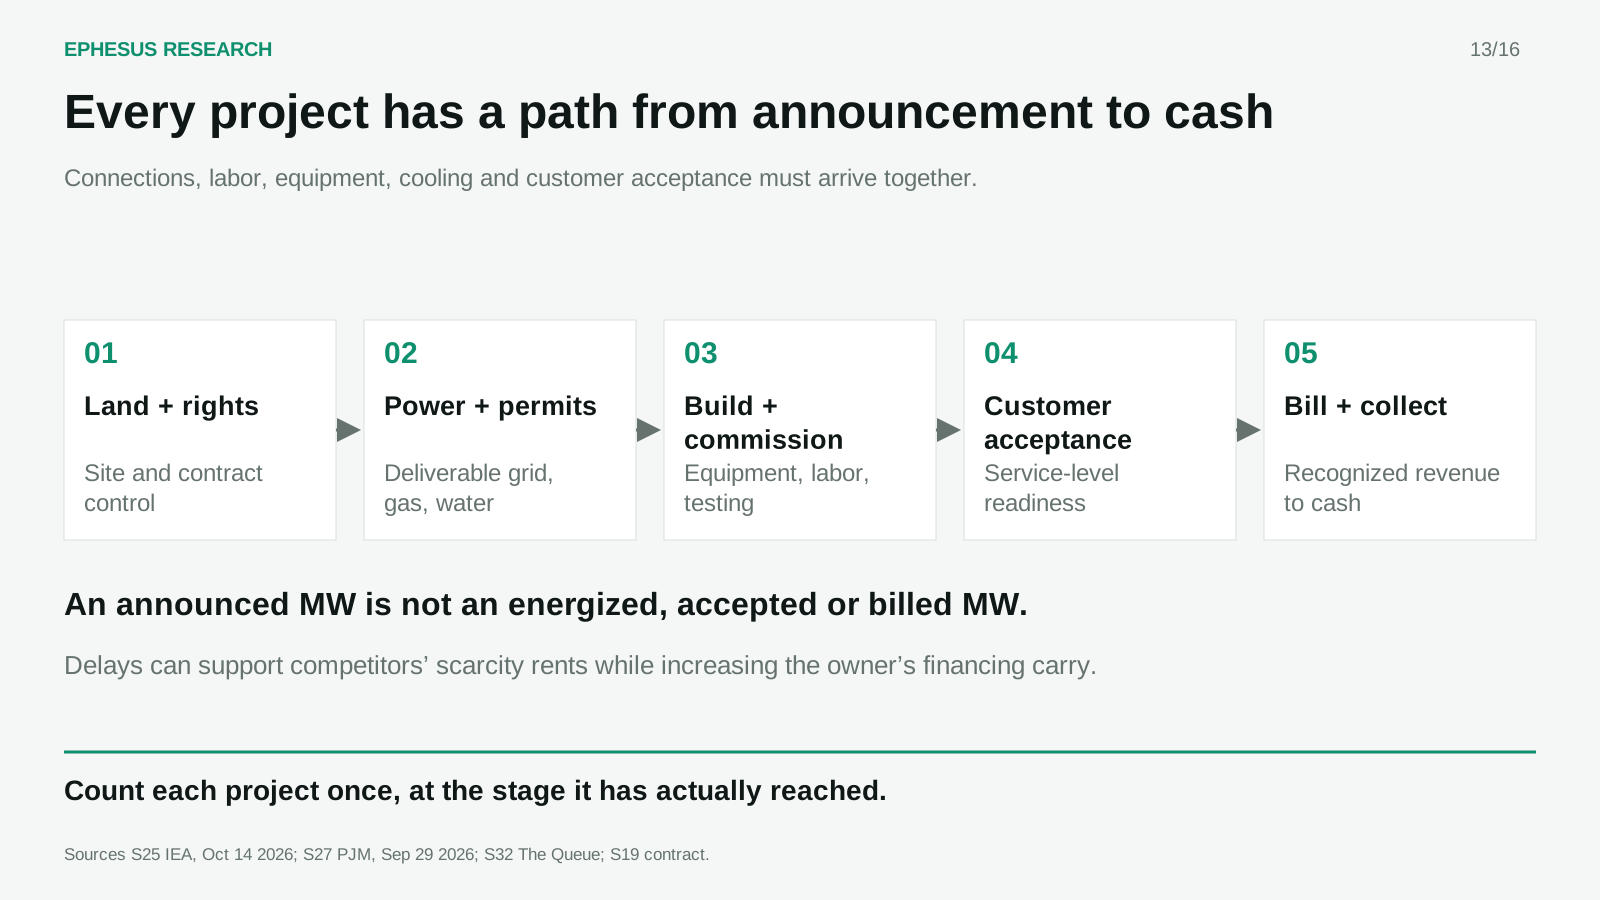
IEA estimated global data-center electricity at 485 TWh in 2025 and projected 950 TWh in 2030 in its April 2026 report. The latter is a forecast for all data centers, not AI alone. Its October 14 report also warns that connection pipelines contain duplicate or speculative projects and gradual ramps. PJM's September process explicitly asks about duplicate requests elsewhere. Scarcity of usable capacity and inflated announced demand can coexist. [S24][S25][S27]
Project diligence follows a sequence: land control; electricity and fuel rights; permits; equipment and financing; energization; commissioning; customer acceptance; billing; collection. Generation nameplate does not equal reliable IT capacity, and a power reservation does not prove a substation is ready. Gas deliverability, water, cooling, fiber, labor and community constraints must be established locally.
A delay can preserve scarcity for operating competitors while harming the delayed owner through interest carry and aging inventory. Conversely, faster non-firm connections may expose customers to curtailment. The thread's broad claims about cheap Chinese power and easy finance remain insufficiently specified by location, borrower and contract. Chip access restrictions warrant separate policy diligence; they do not validate a universal national cost advantage. We found no defensible denominator for its 50% cancellation assertion.
Contracts, debt and equipment run on different clocks
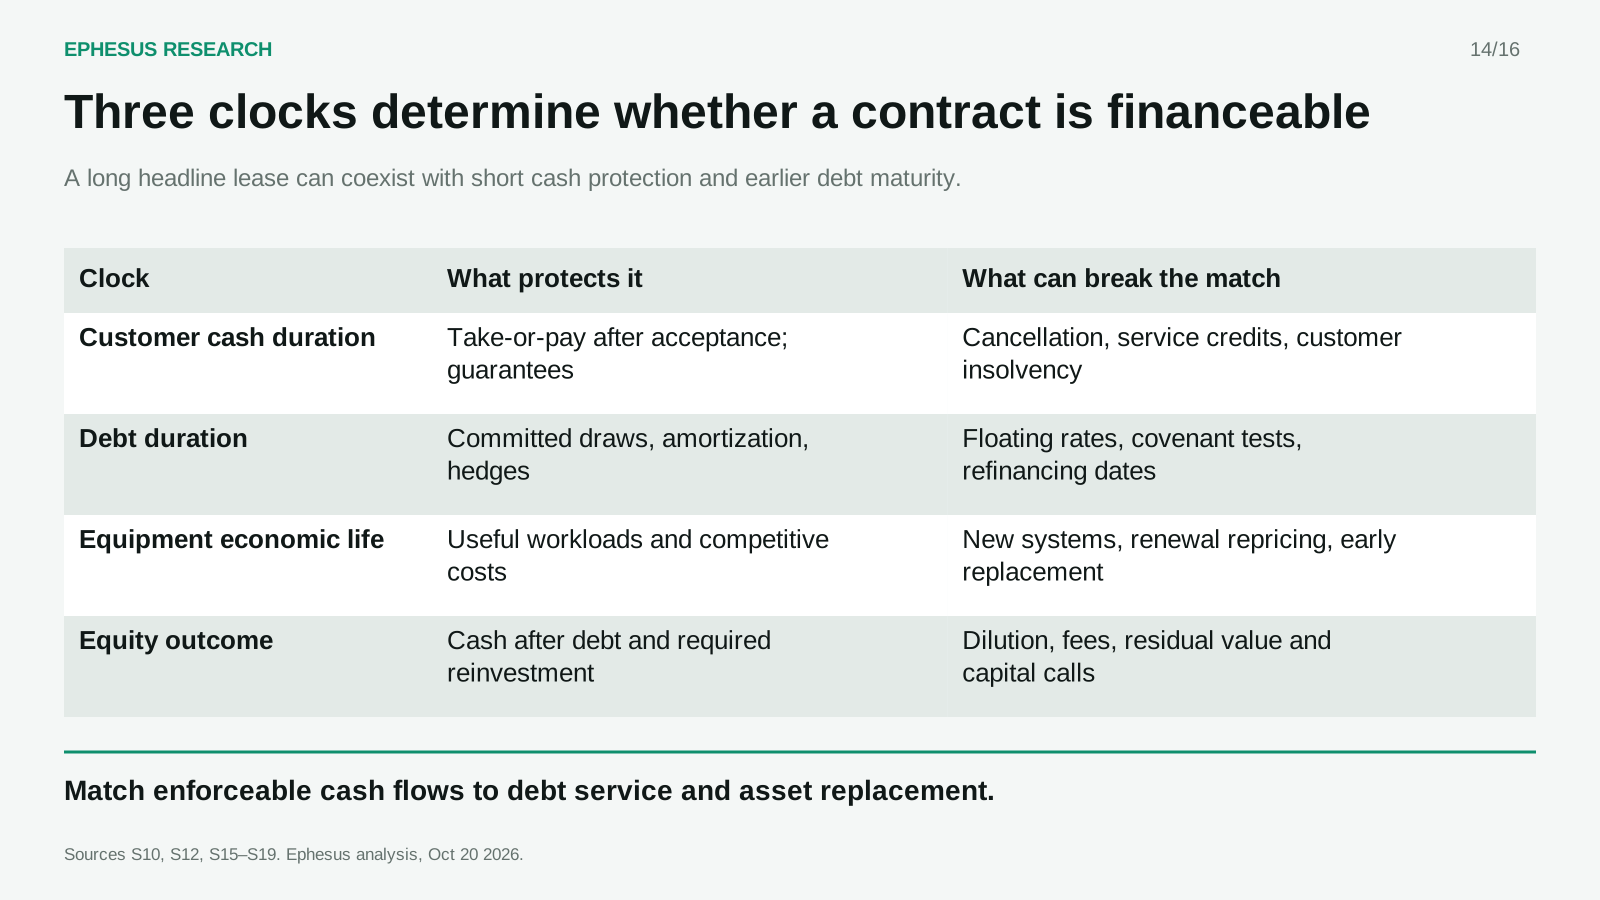
IREN's August 27 release defines an estimated two-year payback as GPU and ancillary capex divided by contracted revenue less estimated direct costs. That is more specific than an undefined payback claim, but still not whole-campus equity IRR. It distinguishes $1 billion operating ARR from $4 billion contracted ARR for 2026 capacity and warns that recognized revenue may be lower. Financing examples include 6% excluding fees and 9% fixed interest, with different customer/deployment characteristics. Prepayments are funding with service obligations. [S14]
CoreWeave's unaudited June 10-Q reports $3.663 billion of first-half operating cash flow against $14.117 billion of equipment/software purchases, a $10.454 billion cash gap before other investing and financing movements. It also reports $103.7 billion of remaining performance obligations, 41% expected within 24 months, and net recourse/non-recourse debt of $31.405/$3.663 billion. Backlog helps underwriting but is not collected cash. Expansion spending prevents this corporate gap from proving weak operating-cohort returns. [S15]
An SPV is a legal container, not evidence of non-recourse financing: a CoreWeave parent guarantee makes that distinction concrete. [S16] Equipment loans, corporate bonds, leases, convertibles and equity allocate different collateral, maturity and dilution risks. Floating rates require a hedge or stress test. Debt service uses principal as well as interest; equity cash flow must include both without charging interest twice.
Cipher's Google-supported structure illustrates conditional protection. The original backstop starts at lease commencement and permits specified alternatives after tenant default. A later phase amendment separates rent commencement and describes notes due in 2030 against a longer operating lease. [S17][S18] Nebius's filed Microsoft agreement has financing, delivery and acceptance conditions; certain failures can trigger damages, termination or repayment. [S19]
Long customer contracts can protect a well-delivered owner even if end demand disappoints. But lock the actual cash duration, not the headline term. Compare cancellation rights, guarantees, amortization and refinancing dates with asset economic life. Remaining unfunded capex and potential dilution belong next to capacity growth. Neither lender support nor a possible government rescue should be assumed without an enforceable commitment.
The next 12, 24 and 36 months: conditional paths
The outlook is best expressed as conditional paths rather than a single industry growth target. At twelve months, through October 2027, deployment and customer acceptance are likely to determine who can monetize scarce capacity. At twenty-four months, renewals and refinancing expose the durability of today's pricing. At thirty-six months, economic replacement and residual values matter increasingly for equipment purchased now. These are analytical focal points, not predictions of synchronized turning dates.
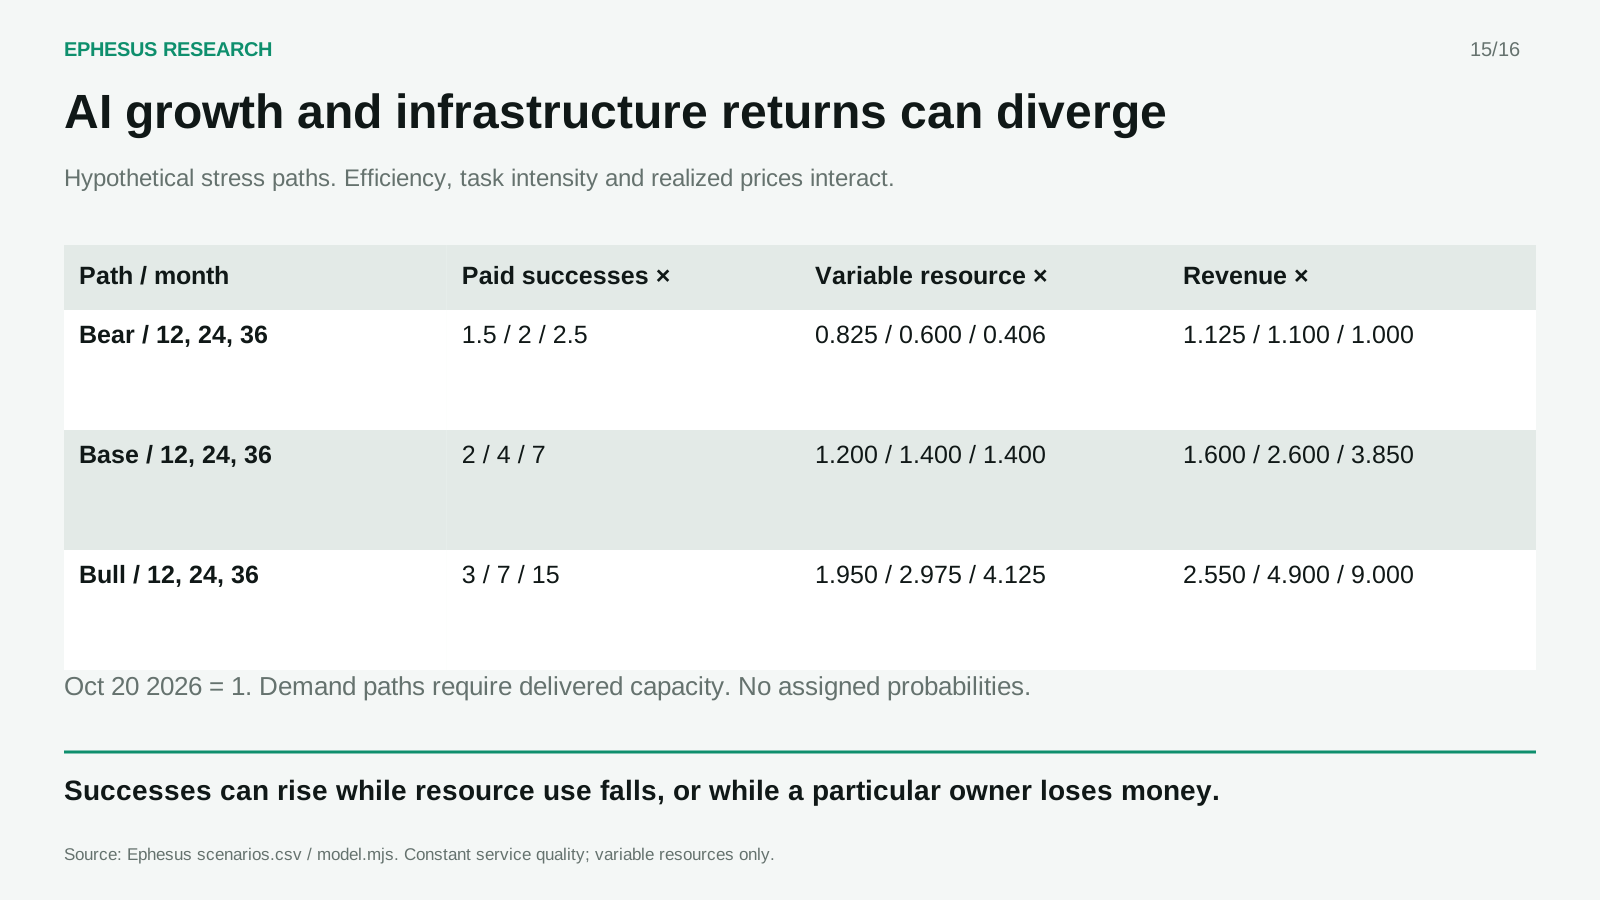
The numerical exercise below is deliberately hypothetical. October 20, 2026 equals one for each consistently defined service index. Paid successful tasks grow differently across cases; total tokens per success also grows. Effective compute efficiency per token improves two, four and eight times at the three horizons, incorporating hardware, software and cache effects once. System energy per compute unit is held constant. Service prices fall at different rates. The model multiplies successes by tokens per success and divides by efficiency for variable resource use; revenue multiplies paid successes by realized price per success. The assumed successes require sufficient delivered capacity; failure to deliver shifts the case downward rather than creating revenue from announced MW. There is no fitted causal elasticity or assigned probability.
| Conditional path | Paid successes × | Variable resource × | Service revenue × |
|---|---|---|---|
| Bear / 12 months | 1.50 | 0.825 | 1.125 |
| Bear / 24 months | 2.00 | 0.600 | 1.100 |
| Bear / 36 months | 2.50 | 0.406 | 1.000 |
| Base / 12 months | 2.00 | 1.200 | 1.600 |
| Base / 24 months | 4.00 | 1.400 | 2.600 |
| Base / 36 months | 7.00 | 1.400 | 3.850 |
| Bull / 12 months | 3.00 | 1.950 | 2.550 |
| Bull / 24 months | 7.00 | 2.975 | 4.900 |
| Bull / 36 months | 15.00 | 4.125 | 9.000 |
Bear: useful adoption expands, but competition and integration friction prevent sufficient paid volume from reaching new supply. Customers can benefit while labs and lightly protected fleets face weak capital recovery. Strong landlord contracts may still protect an accepted facility, subject to counterparty solvency and remedies. Suppliers can experience order deferrals without AI failing technologically.
Base: paid work expands, efficiency absorbs much of the token increase, and regional bottlenecks persist. Integrated hyperscalers retain flexibility; labs need differentiation and collection; GPU clouds separate according to delivery, cost and funding; landlords and electrical suppliers benefit where their contracts convert into cash. This qualitative middle case is preferred, but its numerical multipliers are illustrative, not point forecasts.
Bull: useful applications broaden fast enough that demand overwhelms efficiency gains. Customers obtain valuable output, labs monetize it, and efficient clouds fill delivered capacity. Power and equipment constraints delay some desired usage. High industry growth still cannot rescue an overpaid acquisition or an owner with poor financing.
A separate static stress of the hypothetical 1,000-GPU cohort gives normalized pre-tax residuals after the replacement provision of −$4.04 million at 60% billable utilization and $2/hour, $4.78 million at 75% and $3, and $12.31 million at 90% and $3.50. Physical load is held at 80%; billed utilization can exceed it because the model allows paid reservations of inactive capacity. For this sensitivity, these are not forecasts mechanically derived from the aggregate demand paths. The accompanying calculations vary price, life, tariffs, delay and capital cost explicitly.
Two cross-cases are essential. AI can succeed while infrastructure equity loses money when renewal prices fail to recover sunk capital or debt is refinanced unfavorably. Conversely, demand can disappoint while an owner collects under a strong, non-cancelable contract with a solvent tenant after acceptance. Neither a 2027–2028 adjustment nor uninterrupted scarcity pricing is inevitable.
Who benefits, and what would change our mind
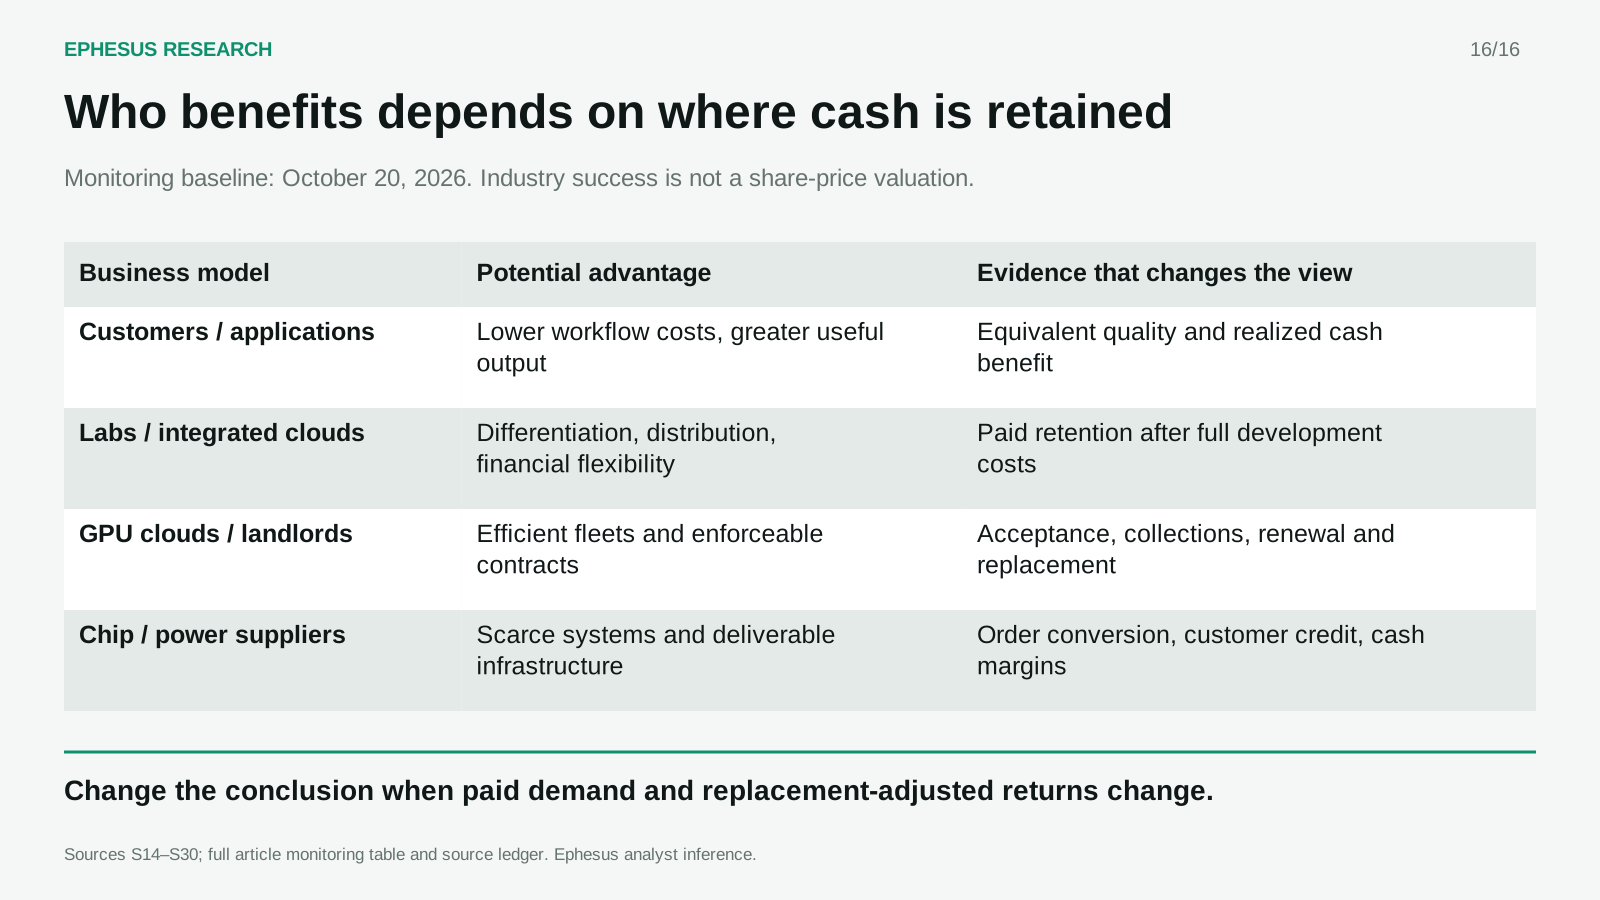
Benefits are likely to be distributed unevenly. Customer savings do not automatically become supplier profits, and supplier profits do not automatically justify the price paid for a security. A compact comparison shows the different tests.
| Business and case | Evidence at the cutoff | What the investor still needs |
|---|---|---|
| Chip/platform supplier: NVIDIA | Q2 FY27 Data Center revenue $89.0bn; consolidated GAAP gross margin 75.0%. Reported, quarter ended July 26. [S21] | Durable orders, customer funding and future competitive margins; buyers' returns are separate. |
| Integrated hyperscaler: Alphabet | Q2 operating cash $39.069bn minus capex $44.924bn = −$5.855bn FCF; trailing-year FCF $53.273bn. [S20] | Incremental AI returns after shared development costs; legacy cash creates flexibility, not unlimited self-funding. |
| Frontier labs | Product pricing and technical usage are visible; comparable standalone replacement-adjusted cash returns remain missing here. | Paid retention, monetization, training/R&D and service costs; open-model competition and renewal pricing. |
| GPU clouds: CoreWeave, IREN, Nebius | Backlog, ARR and signed customer credit differ from accepted service and cash collection. [S14][S15][S19] | Delivery, matched financing, billable utilization, actual contract exits and replacement needs. |
| Application-oriented cloud: DigitalOcean | Q2 reported revenue $281m and adjusted FCF $60.585m. Corporate results include a broader service mix. [S22] | Profitable AI customer cohorts; corporate cash flow is not isolated inference margin. |
| Landlord: Cipher | Contractual credit support becomes effective at the specified operating milestone. [S17] | Completion, rent commencement, remedies, capex responsibility and refinancing. |
| Power/electrical supplier: GE Vernova | Q2 gas equipment backlog 53GW plus 63GW slot reservations. These are distinct categories. [S23] | Conversion into delivered, cash-generating equipment; neither category is energized AI load. |
| Customers | Task-level productivity evidence exists but is heterogeneous. [S29][S30] | Equivalent quality, lower total workflow cost and actual cash savings or incremental sales. |
Our preferred case is continuing AI adoption with a widening spread between strong and weak infrastructure economics. The strongest counterargument is that paid demand and scarce deliverable power may remain strong enough for rapid payback to absorb later price declines. That would improve the investment case if demonstrated in comparable cohorts, not merely announced at the industry level.
Confidence is high in the need to separate units and cash-flow boundaries; moderate in the qualitative expectation of uneven outcomes; low in precise 12–36 month prices or a cycle-turn date. No probabilities are assigned. The thesis changes when paid demand, renewal terms and replacement-adjusted collections change—not simply when the next model benchmark improves.
Monitoring baseline: October 20, 2026. These are research triggers, not scheduled automations.
| Indicator and current baseline | Bull / bear implication | Next source and change-of-view test |
|---|---|---|
| Comparable H100 rental: $2.85/GPU-hour dated October 20; history bridge missing. [S01][S02] | Sustained realizations support existing fleets; weak renewals undermine them. | Silicon Data methodology and cohort renewal disclosures. Change view if matched renewals fail capital-recovery thresholds. |
| Paid task retention/collections: no reconciled industry baseline | Repeat paid use supports demand; token growth without cash weakens it. | Lab/cloud cohort disclosures and customer case studies. Require retention and collected revenue at equivalent service quality. |
| SpaceX: 1.7GW installed nameplate at September 30; payback definition incomplete. [S09][S11] | Accepted deployments support growth; delays or exits weaken forecast conversion. | Next official results and contract disclosures. Revise if annual pricing/capital scope is reconciled or comparable cancellations appear. |
| IREN: operating versus contracted ARR gap. [S14] | Acceptance closes the gap; financing/delivery slippage widens it. | Official quarterly update, financing terms and acceptance evidence. Track recognized revenue, not just repeated ARR. |
| Funding and debt duration: sizable construction needs; mixed recourse. [S15][S16] | Matched maturities help; refinancing dependence and dilution hurt. | SEC debt notes and executed facilities. Revise on covenant stress, expensive renewals or funding closing with credible amortization. |
| Power pipeline: duplicate requests and staged ramps identified. [S25][S27] | Energization validates scarcity rents; repeated postponement strands capital. | Utility acceptance, commissioning and PJM's January 2027 forecast. Count each project once at its attained stage. |
| Economic replacement life: not independently established for new cohorts | Long profitable use helps owners; early repricing erodes capital recovery. | Same-cohort utilization, residual sales and replacement capex. Revise when observed life or rent differs materially from assumptions. |
Calculation appendix
Model AssumptionThe cohort inputs, sensitivity calculations and conditional scenarios are hypothetical. They are not quoted market terms or valuations of the named companies.Calculation boundaries
All figures in this appendix are hypothetical unless linked to a source. The input, output, sensitivity and annual cash-flow files are linked below.
| Required pre-tax capital recovery rate | Annual capital charge, USD m | Break-even rent, USD/billed GPU-hour |
|---|---|---|
| 0% | 10.667 | 2.258 |
| 8% | 13.245 | 2.658 |
| 12% | 14.638 | 2.874 |
| 16% | 16.089 | 3.100 |
The zero-return row merely recovers assumed capital over its life. The positive-rate rows apply separate capital-recovery annuities to four-year IT and fifteen-year facility capital. These pre-tax annuity equivalents are not observed ROIC.
A separate finite four-year example uses $50m initial capital, flat baseline operations, 25% income tax, zero working-capital change, and straight-line depreciation. It sells the remaining facility for an assumed $7.333m at year four, disposes of IT for zero and ends the project. No business terminal multiple or further operating years are included. The assumed sale equals book value, so no disposal tax is added. Project IRR is 10.16%. With $30m initial debt at 10%, repaid $7.5m annually, equity IRR is 13.28%. Interest reduces taxable income in the equity example only. Financing fees and unmodeled capital needs would reduce returns. These hypothetical results are not valuations of the named companies.
The delay stress holds a full year of fixed cost and debt payments while delaying billings and variable energy costs. First-year pre-tax cash after debt service reaches zero at 3.40 months of delay. There is no grace period, incremental construction overrun or refinancing assumed. This is not the maximum tolerable lifetime project delay.
Financial bridge: recognized revenue less operating expenses, including accounting depreciation, produces operating income. Add back noncash charges, subtract operating cash taxes and reflect working-capital changes to reach unlevered operating cash. Subtract actual capital spending for project free cash flow. Equity cash additionally incorporates debt draws, interest, principal and equity contributions. Never charge both a normalized replacement provision and actual replacement again in the same cash flow.
Additional power evidence
LBNL’s June 2026 update models US data-center electricity in 2030 at 649 TWh in its reference case, with a 521–843 TWh scenario range. This differs in geography, vintage and methodology from IEA’s global forecast and must not be spliced into an observed series. [S26] DOE’s March 2026 transformer webinar reports historical 2024 lead times of one to two years or more for distribution transformers, compared with three to six months in 2019. This is evidence of equipment constraints, not an October 2026 quotation for every project. [S28]
Cost-stack discipline: components included in a purchased accelerator or server, such as embedded memory, are not added again. Owned equipment, leased capacity and vendor-financed equipment require consistent treatment across operating cash, capital investment and financing. Training and R&D are included at the lab or integrated business boundary, not automatically charged to a pure landlord.
Billing boundary: the cohort model measures sold or reserved GPU-hours. Paid reservations can remain billable when the hardware is not actively computing, so billable utilization can exceed physical activity. It is not a model in which only active computation is billable.
Supporting data
The downloadable files preserve the approved research calculations and their stated boundaries. The source ledger records access dates, evidence classes and limitations.
- Chart data
- Rental snapshots
- Hypothetical cohort inputs
- Calculation results
- Annual cash flows
- Sensitivity table
- Conditional scenarios
- Delay stress
- Capital recovery
- Source ledger
- Claim register
- CoreWeave cash-flow bridge
Glossary
GPU acquisition / rental / owned-hour cost — Acquisition is capital paid for equipment. Rental is an owner's revenue and renter's expense. Owned-hour cost allocates capital and operating costs over a defined usable-hours denominator.
Input / cached input / output / reasoning — Input is supplied context; cached input reuses prior processing; output is generated content. Reasoning may be technically generated or billed under provider-specific rules. Technical counts need not equal billed counts.
Token price / token cost / successful-task cost — Selling price differs from production expense. Task cost includes every allocated attempt, integration and review at a stated quality and latency.
Throughput — Tokens/second/GPU measures device output; tokens/second/MW measures power-normalized output. Both must state workload, latency, precision and system boundary.
Power and energy — IT MW measures equipment load; facility MW adds cooling and electrical losses. Reserved power is a contractual right; generation nameplate is rated production. MWh measures actual integrated energy. PUE = total facility energy / IT energy.
Utilization — Availability is readiness. Physical utilization measures use of equipment; throughput utilization compares actual output with feasible output. Billable utilization measures sold hours. Reserved capacity can be paid without active use. Collection measures cash received.
Economic units — Construction $/MW is capital intensity; electricity $/MWh is an energy tariff; hosting $/kW-month is a capacity service charge; compute $/MW-year is service revenue per defined annual capacity.
Revenue / contribution / EBITDA / EBIT — Revenue is recognized sales. Contribution subtracts a specified direct or variable cost boundary. EBITDA excludes interest, tax, depreciation and amortization; adjusted EBITDA may exclude more. EBIT deducts operating depreciation but precedes interest and tax.
Operating cash / free cash flow — Operating cash includes working-capital movements and classification-dependent interest/taxes. FCF subtracts the stated capital spending boundary. Neither backlog nor ARR is collected cash.
Project IRR / equity IRR / ROIC — Project IRR discounts unlevered project cash flows. Equity IRR uses cash after borrowing, debt service and equity contributions. ROIC compares after-tax operating profit with defined invested capital. A payback period ignores later cash flows and is not any of these returns.
Depreciation / obsolescence / replacement — Depreciation is accounting allocation. Obsolescence is lost economic competitiveness. Replacement is actual cash investment. An annual replacement provision is a normalization, not actual capex.
Source notes
[S01] Silicon Data, H100 Rental Price Index — 2026-10-20. Original source. FAQ gives stale 2.53. Headline is an index observation, not audited collections. Full comparable history unavailable.
[S02] Silicon Data, methodology revision — 2025-12-05. Original source. No historical restatement/vintage bridge recovered; exact 53% trough comparison remains conditional.
[S03] NVIDIA, inference economics — Accessed 2026-10-20. Original source. Matched latency, context, precision, software, utilization and full TCO details incomplete. Rounded H200 arithmetic does not exactly reconcile.
[S04] SemiAnalysis, InferenceX v2 — 2026-02-16. Original source. FP8/FP4 differences; random inputs; no prefix caching. Example excludes downtime/underutilization. Paid TCO continuation not reviewed.
[S05] Epoch AI, The plunging price of thought — 2026-09-22; updated 09-23. Original source. Benchmark frontier, not a representative customer bill. Chart uses constant-rate illustration, not observed quarterly data.
[S06] Google I/O keynote — 2026-05-19. Original source. Paid share, workload intensity and realized revenue missing. API and all-surfaces measures cannot be spliced.
[S07] OpenAI, API pricing — Accessed 2026-10-20. Original source. Contemporaneous different products, not inflation. Realized discounts and task-equivalent quality not established.
[S08] DeepSeek, DeepInfer deployment Q&A — Accessed 2026-10-20; mutable main branch. Original source. Mutable main branch; fixed commit not recovered. Fleet count/type, occupancy, billing mix and recognized/collected/imputed basis unresolved.
[S09] SpaceX, Q3 2026 earnings release — 2026-10-20; period ended 09-30. Original source. Unaudited company results. Segment includes advertising/software/compute and Cursor contribution; not a pure external rental business. Nameplate excludes facility overhead and is not consumption.
[S10] SpaceX, June 2026 Form 10-Q — Period ended 2026-06-30. Original source. June-period disclosure; contract-specific terms may differ. Cannot infer external cash value from internal transfers.
[S11] Benzinga, SpaceX Q3 call transcription — 2026-10-20. Original source. Transcription, not independently checked audio. Annual pricing basis and payback capital/cash-flow definition not established. Targets are management guidance.
[S12] SpaceX, SEC-filed Japan offering disclosure — 2026-06-05. Original source. Headline multi-year value is not irrevocable cash; use exact ramp and exit terms.
[S13] SpaceX, response to SEC staff — 2026-05-07. Original source. May response describes contemporaneous scope, not an audited October industry ranking.
[S14] IREN, FY26 results — 2026-08-27; fiscal year ended 06-30. Original source. 6% weighted rate excludes fees. ARR is not recognized revenue. Payback does not establish whole-campus equity IRR. Revenue/MW annual basis not explicit.
[S15] CoreWeave, June 2026 Form 10-Q — Period ended 2026-06-30. Original source. Corporate investment phase, not mature-cohort return. CFO already reflects interest. Noncash capex liabilities matter.
[S16] CoreWeave, parent guarantee and pledge — 2026-05-15. Original source. Subject to legal liability limitations. SPV existence alone does not establish non-recourse financing.
[S17] Cipher, Barber Lake agreement 8-K — 2025-09-25; event 09-24. Original source. Later amended. Not evidence the campus was delivered. Backstop is conditional, not universal payment insurance.
[S18] Cipher, phase amendment 8-K — 2025-11-20. Original source. Disclosed delivery targets were not independently confirmed as current operating status.
[S19] Nebius, Microsoft Statement of Work Exhibit 4.4 — Agreement effective 2025-09-07; filed 2026. Original source. Prices/counts/thresholds partly redacted. Contract conditions do not prove a breach.
[S20] Alphabet, Q2 earnings release — 2026-07-22; quarter ended 06-30. Original source. Group capex is not all AI. Cloud segment economics exclude shared AI R&D.
[S21] NVIDIA, Q2 FY27 results — 2026-08-26; quarter ended 07-26. Original source. Supplier returns are separate from equipment purchasers returns.
[S22] DigitalOcean, Q2 results — 2026-08-04; quarter ended 06-30. Original source. Broader company service mix; not an isolated inference profit margin. Selected-customer token growth is not market elasticity.
[S23] GE Vernova, Q2 results — 2026-07-22; quarter ended 06-30. Original source. Reservations are not firm backlog or delivered power; not all commitments relate to AI. Cash flow includes working-capital effects.
[S24] IEA, Key Questions on Energy and AI — 2026-04-16. Original source. All data centers are not all AI. Forecasts are conditional, not observed 2030 consumption.
[S25] IEA, Powering Artificial Intelligence — 2026-10-14. Original source. Hosting capacity or requested GW is not installed, energized or accepted AI compute.
[S26] LBNL, US Data Center Energy Usage: 2025 Update — 2026-06. Original source. Different geography/methodology from global IEA; forecast not an observed load.
[S27] PJM, large-load vetting — 2026-09-29. Original source. PJM does not own a single generator-style load queue. Proposed loads need utility-level verification.
[S28] DOE, Distribution Transformer webinar transcript — 2026-03-05; historical lead-time data. Original source. Not an October 2026 quote for every project or transformer type.
[S29] Brynjolfsson, Li, Raymond, Generative AI at Work — Revised 2024-11-06. Original source. Task-specific study; not a universal profit or electricity result.
[S30] METR, productivity experiment update — 2026-02-24. Original source. Participation/selection changes constrain inference. No universal productivity estimate.
[S31] The Buildout, The Operators — Accessed 2026-10-20. Original source. Framework, not independent proof of specific company returns. Rental contracts vary in power inclusion.
[S32] The Buildout, The Queue — Accessed 2026-10-20. Original source. Exact lead times and cancellation rates require primary project evidence.
[S33] The Buildout, The Money — Accessed 2026-10-20. Original source. Do not adopt blanket claims of self-funded hyperscalers or universal investment-grade-only mandates.
[S34] The Buildout, IREN company profile — Updated 2026-10-19; accessed 10-20. Original source. FY2025 net-income summary conflicts with primary release; primary source controls.
[S35] Silicon Data, H200/H100 May-July observations — 2026-08-04. Original source. Published snapshots, not full daily series. H200 coverage began May 4; launch timing differs.
[S36] Silicon Data, B200 rental update — Page dated 2026-09-24; mixed body dates. Original source. Page/body dates differ. Text saying all terms below spot contradicts 3-month 5.73 versus spot 5.69; not repeated.
[S37] Ephesus Research methodology — Version 1.0, 2026-08-02. Original source. Methodology provides framing, not evidence for market claims. No existing model/review status changed.
[S38] Silicon Data, regional H100 prices — 2026-07-31; partial Q3 observations. Original source. Partial quarter, mixed coverage and segment differences; not a causal estimate.
[S39] UKERC, The Rebound Effect — 2007-10. Original source. Historical literature does not estimate a current AI-specific elasticity.
[S40] The Buildout, IREN FY26 earnings recap — Results dated 2026-08-27; accessed 10-20. Original source. Results date is not established page publication date. Supply-chain implications are analysis, not disclosed purchase orders.
[S41] SpaceX, official Q3 earnings event — 2026-10-20. Original source. Event page retrieved; underlying audio/video was not reviewed. Payback wording relies on S11 transcription.
[S42] Silicon Data, H200 current index — 2026-10-20. Original source. Undated FAQ stale at 3.10; not an audited collected price.
[S43] Silicon Data, B200 current index — 2026-10-20. Original source. Undated FAQ stale at 5.45; not an audited collected price.
Audit this conclusion
The conclusion can be summarized elsewhere. The full Ephesus Research page remains the place to inspect the calculation, evidence, sensitivities, revisions, and contrary evidence behind it.
Evidence guide
Evidence and judgment labels
Statements marked Fact are intended to be directly supported by cited evidence. Guidance, estimates, assumptions, inferences, and speculation remain separately named so they are not mistaken for verified facts.
43
mapped sources
Yes
primary support
Evidence map
Mapped public sources
Silicon Data, H100 Rental Price Index
2026-10-20; accessed 2026-10-20
Relevant finding
H100 neocloud rental index USD 2.85/GPU-hour on October 20.
Review notes
FAQ gives stale 2.53. Headline is an index observation, not audited collections. Full comparable history unavailable.
Relevant pages: Dated headline; index description and FAQ
Silicon Data, methodology revision
2025-12-05; accessed 2026-10-20
Relevant finding
December 2025 coverage and normalization changes.
Review notes
No historical restatement/vintage bridge recovered; exact 53% trough comparison remains conditional.
Relevant pages: Revised A100 and H100 indices
NVIDIA, inference economics
Accessed 2026-10-20; accessed 2026-10-20
Relevant finding
HGX H200 versus GB300 NVL72: 54,000 versus 2.8m tokens/s/MW; USD 4.20 versus 0.12 per million.
Review notes
Matched latency, context, precision, software, utilization and full TCO details incomplete. Rounded H200 arithmetic does not exactly reconcile.
Relevant pages: Cost per Token / TCO table
SemiAnalysis, InferenceX v2
2026-02-16; accessed 2026-10-20
Relevant finding
Latency-dependent efficiency improvements and benchmark conditions.
Review notes
FP8/FP4 differences; random inputs; no prefix caching. Example excludes downtime/underutilization. Paid TCO continuation not reviewed.
Relevant pages: Unit economics; Hopper/Blackwell; TCO discussion
Epoch AI, The plunging price of thought
2026-09-22; updated 09-23; accessed 2026-10-20
Relevant finding
Estimated 47% quarterly fixed-capability inference cost decline.
Review notes
Benchmark frontier, not a representative customer bill. Chart uses constant-rate illustration, not observed quarterly data.
Relevant pages: Key takeaways; methods and limitations
Google I/O keynote
2026-05-19; accessed 2026-10-20
Relevant finding
Monthly all-surfaces 9.7T, about 480T and more than 3.2Q tokens; separate API 19B/minute.
Review notes
Paid share, workload intensity and realized revenue missing. API and all-surfaces measures cannot be spliced.
Relevant pages: AI momentum across the full stack
OpenAI, API pricing
Accessed 2026-10-20; accessed 2026-10-20
Relevant finding
Luna USD 0.50 and Astra USD 50 per million output tokens; standard processing below 272K context.
Review notes
Contemporaneous different products, not inflation. Realized discounts and task-equivalent quality not established.
Relevant pages: Frontier models; pricing footnote
DeepSeek, DeepInfer deployment Q&A
Accessed 2026-10-20; mutable main branch; accessed 2026-10-20
Relevant finding
155T tokens/day; USD 38/GPU-hour at valley pricing; significant storage infrastructure.
Review notes
Mutable main branch; fixed commit not recovered. Fleet count/type, occupancy, billing mix and recognized/collected/imputed basis unresolved.
Relevant pages: Introduction; cluster/storage and KV-cache discussion
SpaceX, Q3 2026 earnings release
2026-10-20; period ended 09-30; accessed 2026-10-20
Relevant finding
Q3 SI revenue 7.560bn, operating income 0.431bn, adjusted EBITDA 4.953bn, capex 16.444bn; 1.7GW installed nameplate September 30.
Review notes
Unaudited company results. Segment includes advertising/software/compute and Cursor contribution; not a pure external rental business. Nameplate excludes facility overhead and is not consumption.
Relevant pages: Superintelligence table; capacity footnote
SpaceX, June 2026 Form 10-Q
Period ended 2026-06-30; accessed 2026-10-20
Relevant finding
xAI wholly owned February 2; cloud cancellation generally possible on 90 days after initial ramp.
Review notes
June-period disclosure; contract-specific terms may differ. Cannot infer external cash value from internal transfers.
Relevant pages: Superintelligence business; cloud contracts; acquisitions
Benzinga, SpaceX Q3 call transcription
2026-10-20; accessed 2026-10-20
Relevant finding
Management under-one-year payback claim; pricing above prior USD 30-50/W; compute and power/cooling targets.
Review notes
Transcription, not independently checked audio. Annual pricing basis and payback capital/cash-flow definition not established. Targets are management guidance.
Relevant pages: CFO Bret Johnsen Q&A; compute and power targets
SpaceX, SEC-filed Japan offering disclosure
2026-06-05; accessed 2026-10-20
Relevant finding
Headline service term through May 2029; 325,000 GPUs and USD 1.25bn monthly; exit after initial three months with 90 days notice.
Review notes
Headline multi-year value is not irrevocable cash; use exact ramp and exit terms.
Relevant pages: Anthropic commercial agreement
SpaceX, response to SEC staff
2026-05-07; accessed 2026-10-20
Relevant finding
Lowest-cost-token claim removed; no comparable measure; depreciation described as largest current cost component.
Review notes
May response describes contemporaneous scope, not an audited October industry ranking.
Relevant pages: Response concerning lowest-cost-token statement
IREN, FY26 results
2026-08-27; fiscal year ended 06-30; accessed 2026-10-20
Relevant finding
IREN two-year GPU/ancillary payback definition; operating/contracted ARR; funding rates and prepayments.
Review notes
6% weighted rate excludes fees. ARR is not recognized revenue. Payback does not establish whole-campus equity IRR. Revenue/MW annual basis not explicit.
Relevant pages: Highlights; assumptions and notes 1-5
CoreWeave, June 2026 Form 10-Q
Period ended 2026-06-30; accessed 2026-10-20
Relevant finding
H1 CFO 3.663bn less cash capex 14.117bn; RPO 103.7bn; debt recourse and maturities.
Review notes
Corporate investment phase, not mature-cohort return. CFO already reflects interest. Noncash capex liabilities matter.
Relevant pages: Printed p7 income; pp11-12 cash flows; Notes 2 and 10
CoreWeave, parent guarantee and pledge
2026-05-15; accessed 2026-10-20
Relevant finding
CoreWeave DDTL V parent guarantee and pledge.
Review notes
Subject to legal liability limitations. SPV existence alone does not establish non-recourse financing.
Relevant pages: Section 2.1(a-b); Article III
Cipher, Barber Lake agreement 8-K
2025-09-25; event 09-24; accessed 2026-10-20
Relevant finding
Cipher original 168MW IT lease; Google support starts at commencement; default remedies and warrants.
Review notes
Later amended. Not evidence the campus was delivered. Backstop is conditional, not universal payment insurance.
Relevant pages: Item 1.01 Recognition and Warrant Agreements
Cipher, phase amendment 8-K
2025-11-20; accessed 2026-10-20
Relevant finding
39MW IT expansion; separate phases/rents; 7.125% notes due 2030.
Review notes
Disclosed delivery targets were not independently confirmed as current operating status.
Relevant pages: Items 1.01 and 8.01
Nebius, Microsoft Statement of Work Exhibit 4.4
Agreement effective 2025-09-07; filed 2026; accessed 2026-10-20
Relevant finding
Nebius financing, acceptance, delay damages and termination conditions.
Review notes
Prices/counts/thresholds partly redacted. Contract conditions do not prove a breach.
Relevant pages: 1.1(e-j); section 2; 3.1-3.4
Alphabet, Q2 earnings release
2026-07-22; quarter ended 06-30; accessed 2026-10-20
Relevant finding
Alphabet Q2 CFO 39.069bn, capex 44.924bn, FCF -5.855bn; TTM FCF 53.273bn.
Review notes
Group capex is not all AI. Cloud segment economics exclude shared AI R&D.
Relevant pages: p9 FCF reconciliation; p8 segment allocation
NVIDIA, Q2 FY27 results
2026-08-26; quarter ended 07-26; accessed 2026-10-20
Relevant finding
NVIDIA 89.0bn Data Center revenue and 75% consolidated GAAP gross margin.
Review notes
Supplier returns are separate from equipment purchasers returns.
Relevant pages: Q2 FY2027 summary
DigitalOcean, Q2 results
2026-08-04; quarter ended 06-30; accessed 2026-10-20
Relevant finding
DigitalOcean revenue about 281m; adjusted FCF 60.585m.
Review notes
Broader company service mix; not an isolated inference profit margin. Selected-customer token growth is not market elasticity.
Relevant pages: Highlights; p13 FCF reconciliation
GE Vernova, Q2 results
2026-07-22; quarter ended 06-30; accessed 2026-10-20
Relevant finding
GE gas firm backlog 53GW plus slot reservations 63GW.
Review notes
Reservations are not firm backlog or delivered power; not all commitments relate to AI. Cash flow includes working-capital effects.
Relevant pages: pp1-2; Power; cash flow
IEA, Key Questions on Energy and AI
2026-04-16; accessed 2026-10-20
Relevant finding
Global data-center electricity 485TWh estimated 2025; 950TWh forecast 2030; AI-focused demand more than triples.
Review notes
All data centers are not all AI. Forecasts are conditional, not observed 2030 consumption.
Relevant pages: Electricity demand summary
IEA, Powering Artificial Intelligence
2026-10-14; accessed 2026-10-20
Relevant finding
Duplicate/speculative connection requests; phased ramp-up and non-firm curtailment trade-offs.
Review notes
Hosting capacity or requested GW is not installed, energized or accepted AI compute.
Relevant pages: Executive summary; connection capacity and load ramps
LBNL, US Data Center Energy Usage: 2025 Update
2026-06; accessed 2026-10-20
Relevant finding
US data-center 2030 reference 649TWh; range 521-843TWh.
Review notes
Different geography/methodology from global IEA; forecast not an observed load.
Relevant pages: 2025 update summary and scenarios
PJM, large-load vetting
2026-09-29; accessed 2026-10-20
Relevant finding
PJM requests duplicate-load checks; next forecast January 2027.
Review notes
PJM does not own a single generator-style load queue. Proposed loads need utility-level verification.
Relevant pages: Large-load vetting and next forecast
DOE, Distribution Transformer webinar transcript
2026-03-05; historical lead-time data; accessed 2026-10-20
Relevant finding
Historical 2024 lead times one to two years versus 2019 three to six months.
Review notes
Not an October 2026 quote for every project or transformer type.
Relevant pages: Distribution transformer lead-time discussion
Brynjolfsson, Li, Raymond, Generative AI at Work
Revised 2024-11-06; accessed 2026-10-20
Relevant finding
5,172 support agents; approximately 15% average productivity improvement with heterogeneous effects.
Review notes
Task-specific study; not a universal profit or electricity result.
Relevant pages: Abstract and main results
METR, productivity experiment update
2026-02-24; accessed 2026-10-20
Relevant finding
Earlier measured coding slowdown should not be applied mechanically to current tools; newer causal magnitude uncertain.
Review notes
Participation/selection changes constrain inference. No universal productivity estimate.
Relevant pages: 2026 experiment update; selection concerns
The Buildout, The Operators
Accessed 2026-10-20; accessed 2026-10-20
Relevant finding
Taxonomy of integrated clouds, GPU specialists and mining-site conversions; paid utilization.
Review notes
Framework, not independent proof of specific company returns. Rental contracts vary in power inclusion.
Relevant pages: What operators do; three tiers
The Buildout, The Queue
Accessed 2026-10-20; accessed 2026-10-20
Relevant finding
Coordination of grid, equipment, cooling, network, permits and labor.
Review notes
Exact lead times and cancellation rates require primary project evidence.
Relevant pages: Interacting bottlenecks; critical path; permitting
The Buildout, The Money
Accessed 2026-10-20; accessed 2026-10-20
Relevant finding
Distinguishes funding providers, capital transfers and ultimate customer demand.
Review notes
Do not adopt blanket claims of self-funded hyperscalers or universal investment-grade-only mandates.
Relevant pages: Who is paying; circular financing
The Buildout, IREN company profile
Updated 2026-10-19; accessed 10-20; accessed 2026-10-20
Relevant finding
Discovery questions about IREN financing, ARR and capacity.
Review notes
FY2025 net-income summary conflicts with primary release; primary source controls.
Relevant pages: Verdict; capacity/funding; supply chain
Silicon Data, H200/H100 May-July observations
2026-08-04; accessed 2026-10-20
Relevant finding
May 4 and July 27 H100/H200 rental snapshots.
Review notes
Published snapshots, not full daily series. H200 coverage began May 4; launch timing differs.
Relevant pages: Opening paragraph; Twelve Weeks section
Silicon Data, B200 rental update
Page dated 2026-09-24; mixed body dates; accessed 2026-10-20
Relevant finding
B200 July 27; all three generations September 7; term quotes.
Review notes
Page/body dates differ. Text saying all terms below spot contradicts 3-month 5.73 versus spot 5.69; not repeated.
Relevant pages: Index definition; term structure; generational spread
Ephesus Research methodology
Version 1.0, 2026-08-02; accessed 2026-10-20
Relevant finding
Ephesus style: separate fact, guidance, inference and assumptions; gates and dilution.
Review notes
Methodology provides framing, not evidence for market claims. No existing model/review status changed.
Relevant pages: Evidence separation; model review and financial boundaries
Silicon Data, regional H100 prices
2026-07-31; partial Q3 observations; accessed 2026-10-20
Relevant finding
Regional hyperscaler H100 declines 26-54% from Q1 2025 to partial Q3 2026 coexist with neocloud recovery.
Review notes
Partial quarter, mixed coverage and segment differences; not a causal estimate.
Relevant pages: Compression by region; coverage note
UKERC, The Rebound Effect
2007-10; accessed 2026-10-20
Relevant finding
Distinguishes savings, partial rebound, full rebound and backfire.
Review notes
Historical literature does not estimate a current AI-specific elasticity.
Relevant pages: Definitions and evidence on direct/indirect/economy-wide rebound
The Buildout, IREN FY26 earnings recap
Results dated 2026-08-27; accessed 10-20; accessed 2026-10-20
Relevant finding
Cross-check for IREN commissioning, Dell demand and competitor-capacity questions.
Review notes
Results date is not established page publication date. Supply-chain implications are analysis, not disclosed purchase orders.
Relevant pages: Implications for buildout; supply-chain impact
SpaceX, official Q3 earnings event
2026-10-20; accessed 2026-10-20
Relevant finding
Confirms official SpaceX earnings-event availability.
Review notes
Event page retrieved; underlying audio/video was not reviewed. Payback wording relies on S11 transcription.
Relevant pages: Q3 earnings call webcast link
Silicon Data, H200 current index
2026-10-20; accessed 2026-10-20
Relevant finding
H200 USD 3.53/GPU-hour October 20.
Review notes
Undated FAQ stale at 3.10; not an audited collected price.
Relevant pages: Dated headline
Silicon Data, B200 current index
2026-10-20; accessed 2026-10-20
Relevant finding
B200 USD 6.14/GPU-hour October 20.
Review notes
Undated FAQ stale at 5.45; not an audited collected price.
Relevant pages: Dated headline
Version control
Article change log
The Jevons Question: Cheaper Intelligence, More Compute—But Who Gets Paid?
Oct 20, 2026
Published a source-led examination of cheaper AI, compute demand and infrastructure returns, with 16 visuals and supporting datasets.
Reason
Separate technical efficiency, paid demand, resource use and investor cash returns; make assumptions and unresolved evidence inspectable.
Source
43-source ledger and transparent hypothetical cohort calculations
Estimated effect
Adds industry research and monitoring criteria; no existing issuer model assumptions or valuations change.
Research status
Research status
Current
Conclusion
Mixed
Version
1.0.0
Last reviewed
Oct 20, 2026
Access
Public and free
Continue reading
Related public research
IREN · NUAI · WULF
The Hidden Credit Link in the AI Power Boom
This report examines the credit channel linking frontier-model economics to data-center and power-development finance. Version 1.1 adds two explicit circuit breakers: proprietary providers can retain disproportionate monetization after losing token share, and stronger technology balance sheets can substitute for weaker standalone lab credit. The likely near-term result is financing bifurcation rather than uniform contraction.
IREN
IREN: Five-Year DCF and Buildout Valuation
A current preliminary cohort-cash DCF mapped to the live Google Drive workbook. The analysis distinguishes IREN's official capacity stages, cohort financing, five-year primary GPU life, non-core post-contract tail economics, residual support, revenue sharing, and public community-model reference outputs.
IREN · WULF · CIFR · APLD · NUAI
AI Infrastructure: Cap Rates Versus Long-Term Bond Yields
A practical framework for understanding when higher long-duration yields should compress infrastructure values and when contracted NOI growth can offset part of the pressure.
Challenge a fact, formula, or interpretation.
Submissions are reviewed before publication. Credited contributors are listed only with permission; private email addresses are never displayed publicly.